Pairs Trade: Regions Financial vs Zions Bancorporation
- Posted by Greg Harmon
- on February 7th, 2011
While preparing for the coming week I noted Earlier on StockTwits that the charts of the regional banks still looked good, referring back to my article on them from about a week ago (link below). Of course there are some regionals that are better than others. A pairs trade can take advantage of that and reduce the down side risk.
The Set Up
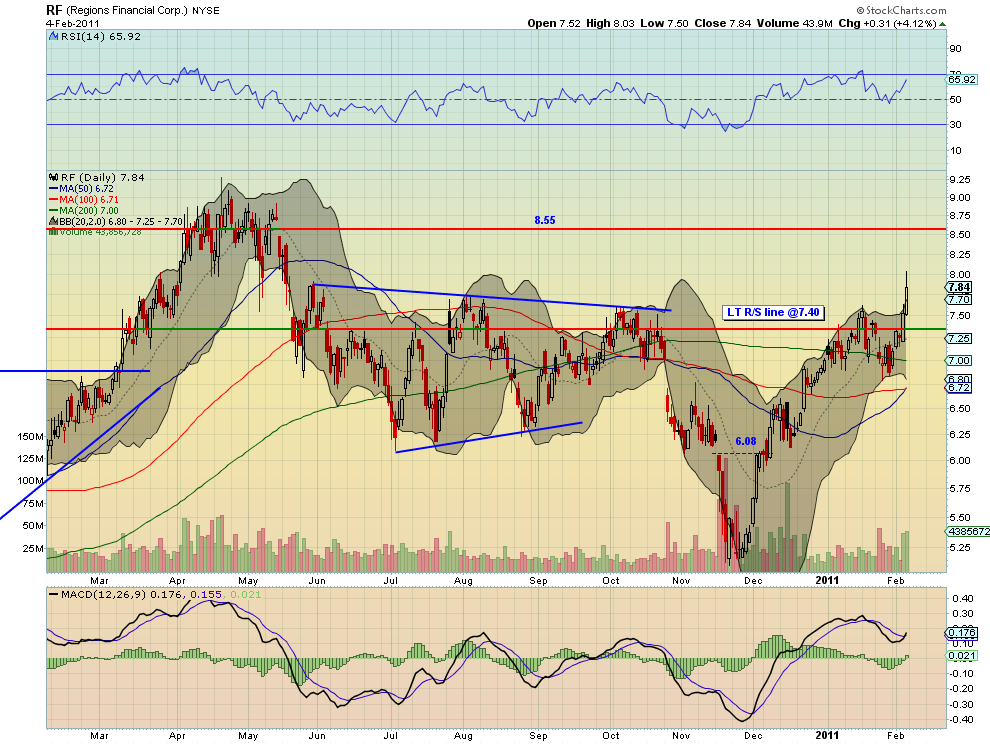
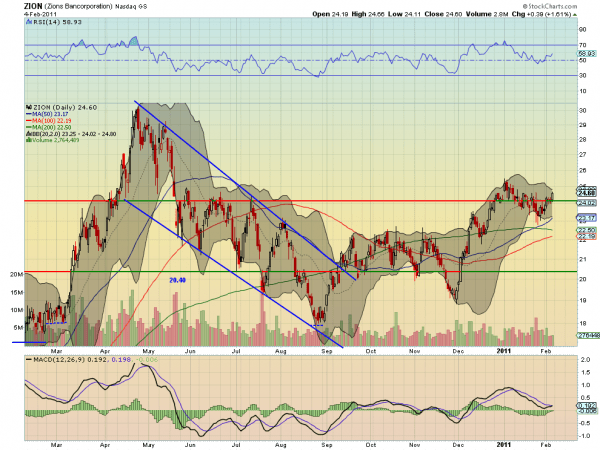
Above is the chart for Regions Financial. This is one of the better looking regionals. Notice the price is pushing the Bollinger bands higher off of back to back strong up moves. The Moving Average Convergence Divergence (MACD) indicator has turned positive and is crossing higher and the Relative Strength Index (RSI) is heading higher. Additionally the 50 day Simple Moving Average (SMA) is crossing higher through the 100 day SMA. This looks to move higher to resistance at 8 and then 8.55. This would be a good long play in itself. Now look at the chart below for Zions Bancorporation below. This stock is also moving up but not quite as strongly. It is still tangling with the long term support resistance are at 24.10 and then resistance above that up to 25 or so. The RSI is rising and it has support from the MACD which is about to cross. But as it is reaching the Bollinger bands, they are not expanding like in Regions. This is not a horrible set up but clearly not as good as Regions Financial.
The Trade
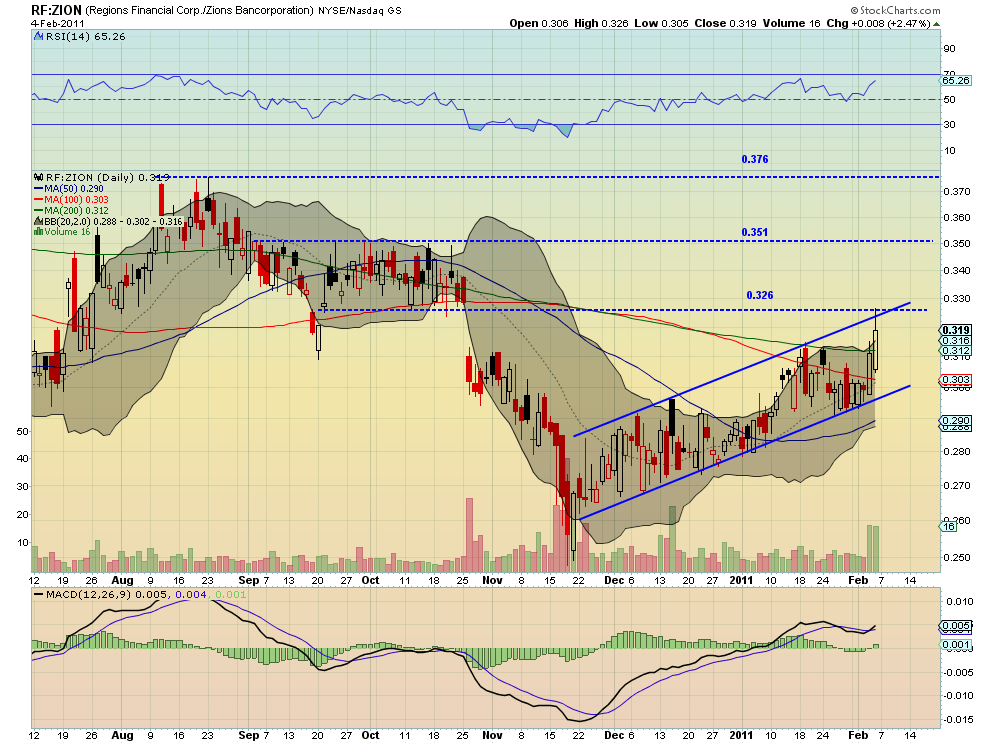
Now look below at the ratio chart of Regions vs Zions. This ratio has been in an uptrending channel since mid November. But there are indications that it may be about to break out higher. First the ratio just broke through both the 100 day and 200 day SMA’s. Next it has touched upside resistance at 0.326 as the channel is about to cross that level as well. Third, it is pushing the Bollinger bands to expand as it is piercing the top band. It will get support moving higher from a MACD that has just turned positive and has crossed and an RSI that is rising towards the technically overbought line.
Trade Idea: Long 3 lots of RF vs short 1 lot of ZION on a break of 0.326, with stop at 0.319
Going long Regions vs short Zion with a target of at least the 0.351 level would net $1.72 – 1.82 per pair traded, with downside risk at $0.55, a 3:1 reward to risk ratio. If it can get to the past high at 0.376 then the pay off is $3.20 – 3.68 per pair traded. This is done with no cash outlay. Remember to scan for these types of opportunities when you find a hot sector. You may be able to improve your risk reward ratio by adding the short side. Trade’m well.
Choose a Snack not a Meal: Regionals over Big Banks
(As always you can see details of individual charts and more on my StockTwits feed and on chartly.)
If you like what you see above sign up for deeper analysis and trading strategy by using the Get Premium button above. As always you can see details of individual charts and more on my StockTwits page.
The information in this blog post represents my own opinions and does not contain a recommendation for any particular security or investment. I or my affiliates may hold positions or other interests in securities mentioned in the Blog, please see my Disclaimer page for my full disclaimer.
blog comments powered by Disqus
-
 Gregory W. Harmon CMT, CFA, has traded since 1986 and held senior positions including Head of Global Trading, Head of Product Development, Head of Strategy and Director of Equity. (More)
 -
Subscribe to Dragonfly Capital Views
Lifetime Subscription
$4,000.00Sign upAnnual Subscription
$1,000.00Sign upQuarterly Subscription
$350.00Sign up
Recent Posts
- Premium Earnings 10-13-26: Fastenal and Morgan Stanley
- Bull Scan for 10-13-26
- Premium Earnings 10-12-26: Citigroup and Johnson & Johnson
- 4 Trade Ideas Wells Fargo: Bonus Idea
- 5 Trade Ideas for Monday: AbbVie, Airbnb, Affirm, GE Aerospace and Walmart
- Top Trade Ideas for the Week of October 12, 2026: The Rest Premium
- Top Trade Ideas for the Week of October 12, 2026: The Best
- SPY Trends and Influencers October 10, 2026
- Macro Week in Review/Preview October 9, 2026
- Bull Scan for 10-12-26
Archives