Choose a Snack not a Meal: Regionals over Big Banks
- Posted by Greg Harmon
- on January 27th, 2011
If you already have too much on your plate to consider the work to decide whether to buy the big banks with their mortgage, credit card and trading why not try the smaller snack size regionals. Here are four names with great technicals that may be ready to break out. All have shown signs of rising off of the the bottom and oddly enough they seem to be improving in alphabetical order.

Huntington Bancshares, HBAN, fell from a consolidating top last week and retested the long-term support and resistance line at 6.75. At the bottom, after piercing through its lower Bollinger band, it printed a doji candle signaling indecision or a potential reversal which was confirmed the next day. It is now rising again and retesting the resistance are near 7.25. The Relative Strength Index (RSI) bounced off of the mid line and is heading higher and the Moving Average Convergence Divergence (MACD) indicator has been improving and looks ready to print a bullish cross. These suggest that the move higher will continue. If it can break through the resistance at 7.25 this time look for a target of 7.80 to 8.00 consistent with the sizes of the previous two moves up.
Keycorp, Ticker: KEY
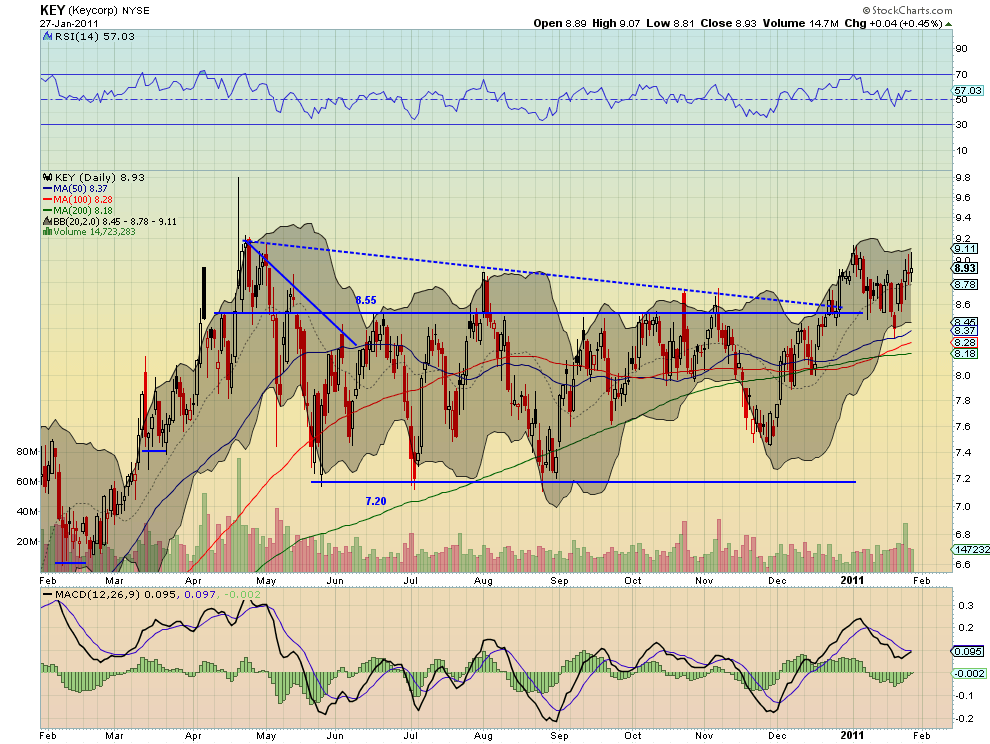
Keycorp, KEY, fell from 2009 year end highs through its long-term support area at 8.55. In doing so it tagged support of its 50 day Simple Moving Average (SMA) and probed outside of the lower Bollinger band, only to close that day printing a bullish Hammer candle. Since then it has moved higher and is probing that top again with long shadowed candles. If it can get above 9.15, the previous high close in April, then the first target would be 10.20 on a similar move to the previous move higher. The MACD cross and improvement will aid this assault at 9.15 as will the RSI that recently bounced off of the mid-line.
PNC Financial Services, Ticker: PNC
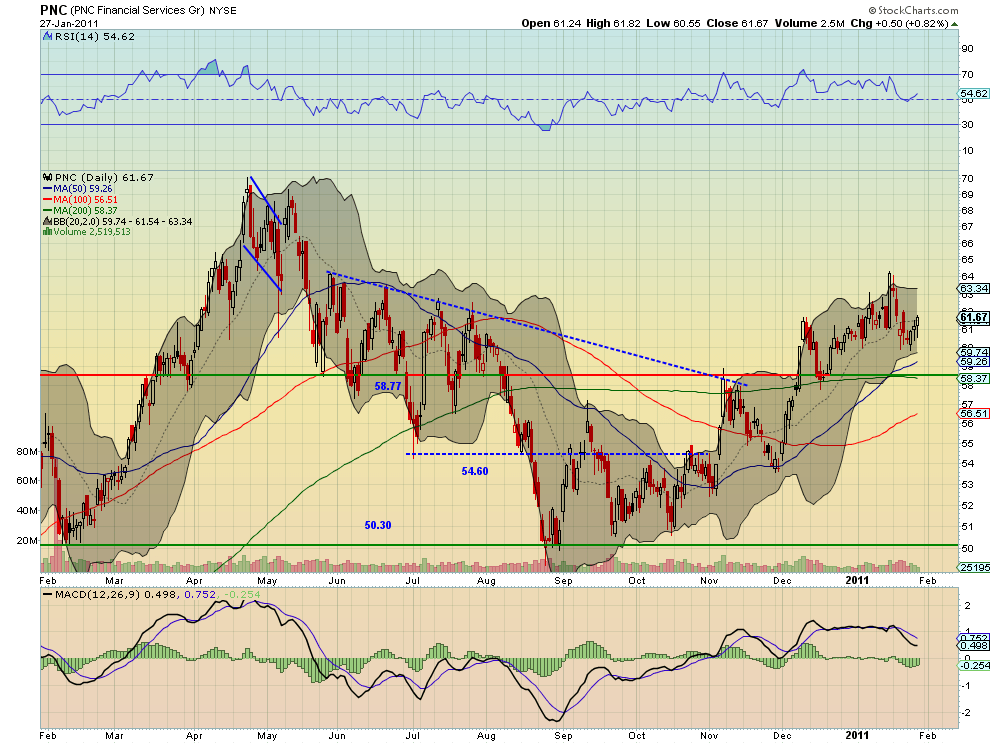
PNC Financial, PNC, printed its most recent high only nine days ago. It then fell lower and printed its potential reversal signal last Friday, a doji, which was confirmed by a move higher on Monday. It is now starting to move higher. It must get through the middle of the Bollinger band to get moving and take a run at the previous top at 64.22. In its favor the RSI is moving higher after bouncing off of the mid line and the MACD is improving and showing signs it may cross in a few days. It initial target on achieving a new high would be 66 and then 70.
Regions Financial, Ticker: RF
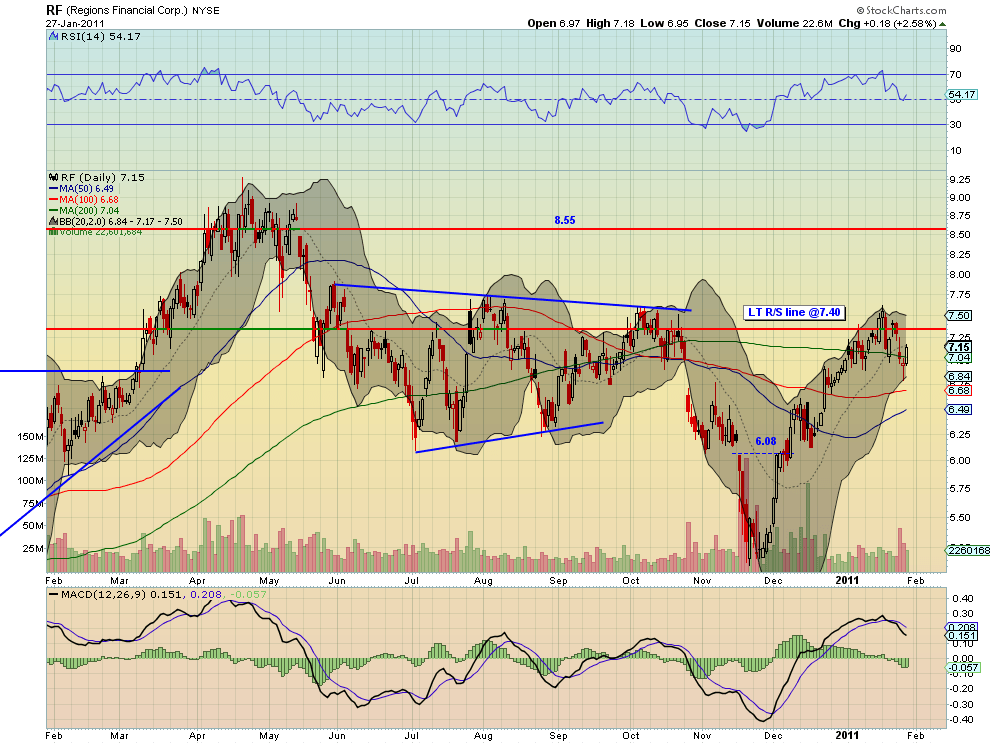
Regions Financial, RF, printed its recent high last Tuesday at 7.52 and then fell back under its long term support and resistance area at 7.40. After falling through its 200 day SMA and touching the bottom of the Bollinger bands it, it printed a doji with along shadow Wednesday. This was confirmed as a reversal Thursday with a strong move higher, but only to the middle of the Bollinger bad. The RSI has turned higher after bouncing off of the mid line, and the MACD is leveling but not yet adding to the bullish sentiment. If RF can get back through the 7.40 area and then break the previous high, a target would be 8.25 and then the resistance area at 8.55. A lot to get through, but then again, if it only gets to the previous high and does not break it that is still at 4.7% return.
Trade’m well.
As always you can see details of individual charts and more on my StockTwits feed and on chartly.)
If you like what you see above sign up for deeper analysis and trading strategy by using the Get Premium button above. As always you can see details of individual charts and more on my StockTwits page.
The information in this blog post represents my own opinions and does not contain a recommendation for any particular security or investment. I or my affiliates may hold positions or other interests in securities mentioned in the Blog, please see my Disclaimer page for my full disclaimer.
blog comments powered by Disqus
-
 Gregory W. Harmon CMT, CFA, has traded since 1986 and held senior positions including Head of Global Trading, Head of Product Development, Head of Strategy and Director of Equity. (More)
 -
Subscribe to Dragonfly Capital Views
Lifetime Subscription
$4,000.00Sign upAnnual Subscription
$1,000.00Sign upQuarterly Subscription
$350.00Sign up
Recent Posts
- Premium Earnings 10-13-26: Fastenal and Morgan Stanley
- Bull Scan for 10-13-26
- Premium Earnings 10-12-26: Citigroup and Johnson & Johnson
- 4 Trade Ideas Wells Fargo: Bonus Idea
- 5 Trade Ideas for Monday: AbbVie, Airbnb, Affirm, GE Aerospace and Walmart
- Top Trade Ideas for the Week of October 12, 2026: The Rest Premium
- Top Trade Ideas for the Week of October 12, 2026: The Best
- SPY Trends and Influencers October 10, 2026
- Macro Week in Review/Preview October 9, 2026
- Bull Scan for 10-12-26
Archives