Your House is Settling Not Falling Apart – Sector Review Part I: Weekly
- Posted by Greg Harmon
- on April 9th, 2011
In my previous life as a homeowner I was always paranoid about the structure of my homes. I have owned 5 homes, and each one has added to my knowledge of how structures age. Two of these were less than 5 years old when I bought them, and the other 3 over 75 years old. The ones that gave me the most grief were the newer homes. They always seem to be falling apart. But upon reflection they are the shiniest and brightest with more downside potential then upside in the short run. As they settle every crack or creek seems to be a major issue creating swings in my paranoia. Older homes show their flaws right from the start but also their core strength. The stairwells continue to settle but the added flaws are not distinguishable or material. And the opportunity to improve and brighten the home is large. It is easier to live in them. A radiator creek in the middle of the night in a 90 year old home just reminds you that the heat is on not make you run to the basement to check that the pipes are still connected.
The past week in the market reminds me of these differences between an older and newer house, as there are cracks showing up. But believe it or not there are some bright spots in this market as seen in the weekly charts for the SPDR Sector funds.
Newer Homes
The sectors of the market acting like those newer homes are the Industrials Select Sector SPDR,$XLI, Technology Select Sector SPDR,$XLK and Consumer Discretionary Select Sector SPDR,$XLY. This makes intuitive sense at least for XLK and XLY. They contain the racy hot new companies. Look at the weekly chart for the XLK below.
Technology Select Sector SPDR,$XLK
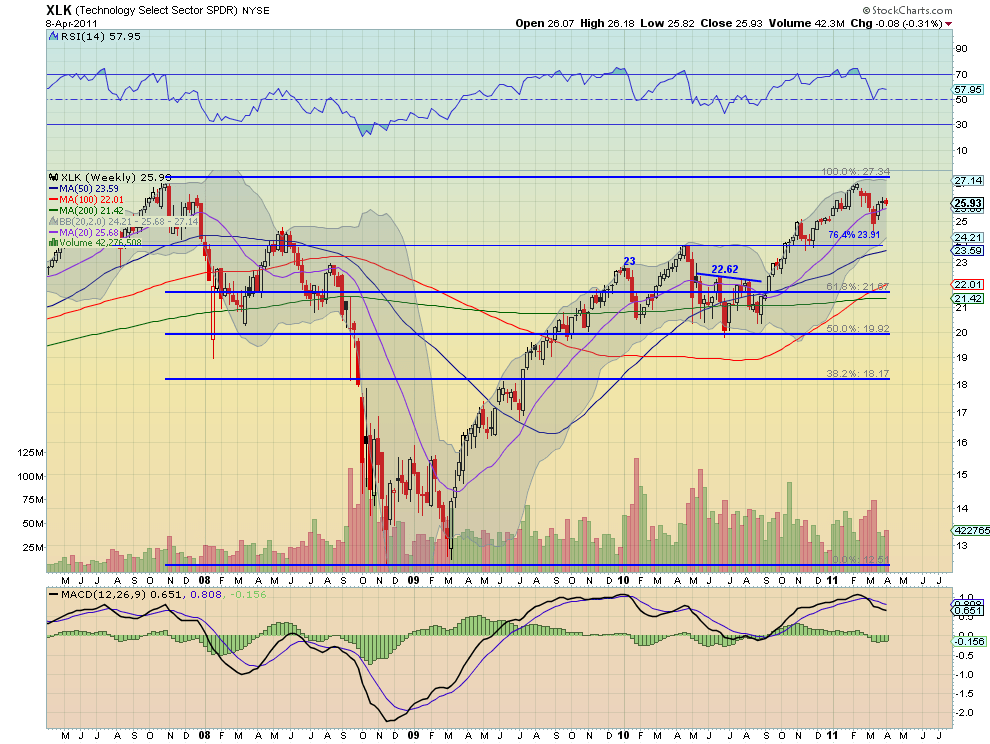
It has advanced over the last 3 weeks but on decreased volume after a large volume sell off the previous weeks. This past week it printed a bearish engulfing candle just above the 20 week Simple Moving Average (SMA), which is rising. It has a Relative Strength Index (RSI) that is rolling lower and a Moving Average Convergence Divergence (MACD) indicator that is negative and growing more so. The XLI and XLY are similar. The prospect for these sectors is lower, but could swing right back. Sentiment plays a big role in these sectors as weekly same store sales figures and trends impact the XLY and high earnings and sales expectations and rumors of new products are creating volatility in the XLK. Every creak and crack seems to be a big deal.
Old Homes
On the other end of the spectrum are those sectors that may have a few cracks but the overall structure looks very sound. These include Materials Select Sector SPDR,$XLB, Materials Select Sector SPDR,$XLB and Health Care Select Sector SPDR,$XLV. The chart of XLV is a good example for discussion.
Health Care Select Sector SPDR,$XLV
These sectors have also run up the last few weeks on reduced volume but they have created some separation from the 20 week SMA and their RSI is still pointing higher. Each also has a MACD that is either positive, like XLV, or is crossing to positive and they are at the top of their Bollinger bands. All three are also at multi-year or all time highs. The cracks come in the last weekly candle. The XLV and XLB printed shooting stars an the XLP an evening star. All are potential reversal candles, but need to be confirmed by a lower print this coming week. A crack in the old homes for capital, defensive sectors, but they still look the strongest.
Vacation Homes and Holiday Destinations
That means the remaining sectors must fit into this category, with the Energy Select Sector SPDR,$XLE the Holiday Destination and the Financials Select Sector SPDR,$XLF and Utilities Select Sector SPDR,$XLU the Vacation Homes. These two groups may not seem to have commonalities but both accommodations are expected to be solid even though you do not live there. From the XLE chart clearly money has been vacationing there for quite a while.
Energy Select Sector SPDR,$XLE

Nothing but a steep rise. Rio during Mardi Gras. But the RSI is in the technically overbought condition and is starting to roll lower and the MACD has been slowly losing ground. Is the vacation ending? Probably not yet but watch as the tourists start to pack to return home and don’t miss the last plane. The XLF and XLU have been acting more like that timeshare you bought back in the 90’s. Someone else takes care of it and you have been there so many times you will go visit now only if there is no place more exciting to be or some new attraction opens nearby. The XLF paints the picture.
Financials Select Sector SPDR,$XLF
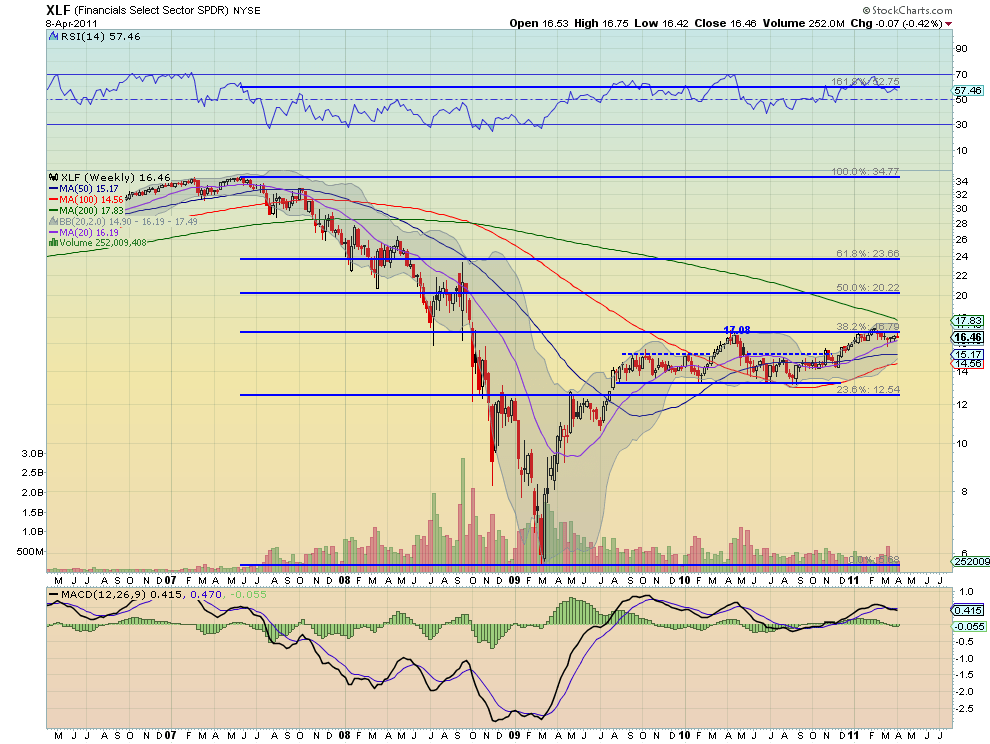
The RSI is bouncing in a range and the MACD for these sectors is flat lined. They are both also at key Fibonacci retracement levels with the XLF at the 38.2% retracement and the XLU at the 61.8% retracement from the fall to the March 2009 lows. Watch for that new attraction to go back and check them out.
As always you can see details of individual charts and more on my StockTwits feed and on chartly.)
If you like what you see above sign up for deeper analysis and trading strategy by using the Get Premium button above. As always you can see details of individual charts and more on my StockTwits page.
The information in this blog post represents my own opinions and does not contain a recommendation for any particular security or investment. I or my affiliates may hold positions or other interests in securities mentioned in the Blog, please see my Disclaimer page for my full disclaimer.
blog comments powered by Disqus
-
 Gregory W. Harmon CMT, CFA, has traded since 1986 and held senior positions including Head of Global Trading, Head of Product Development, Head of Strategy and Director of Equity. (More)
 -
Subscribe to Dragonfly Capital Views
Lifetime Subscription
$4,000.00Sign upAnnual Subscription
$1,000.00Sign upQuarterly Subscription
$350.00Sign up
Recent Posts
- Bull Scan for 10-13-26
- Premium Earnings 10-12-26: Citigroup and Johnson & Johnson
- 4 Trade Ideas Wells Fargo: Bonus Idea
- 5 Trade Ideas for Monday: AbbVie, Airbnb, Affirm, GE Aerospace and Walmart
- Top Trade Ideas for the Week of October 12, 2026: The Rest Premium
- Top Trade Ideas for the Week of October 12, 2026: The Best
- SPY Trends and Influencers October 10, 2026
- Macro Week in Review/Preview October 9, 2026
- Bull Scan for 10-12-26
- How this Week’s Premium Top 10 Performed, October 9, 2026
Archives