Top 10 Trade Ideas for Week of November 22, 2010
- Posted by Greg Harmon
- on November 21st, 2010
After looking at over 500 charts and posting my thoughts on many of them, I have found some good setups for the week. This week’s list contains 9 long ideas and 2 short plays. These were selected and should be viewed in the context of the broad market daily and weekly trend, reviewed Saturday, which looks brighter for Gold and US Treasury Bonds. The US Dollar Index looks to continue the move lower and Crude Oil is undecided but better to the upside as long as it holds 81. Equities, including emerging markets look to move higher, trying to pass and gain some distance from the 20 SMA’s. Overhead resistance and the test lower this past week suggest a cautious but positive stance. Back to the wall of worry. From the Sector Review the best places to look are the Energy and Consumer Discretionary sectors and the worst Utilities.
(As always you can see details of these individual charts and more on my twitter feed and on chartly.)
Here are the top ten for the week in no particular order:
1. Teva Pharmaceutical Industries, Ticker: TEVA

Teva is forming a bottom with the consolidation channel between 50 and 51. The Moving Average Convergence Divergence (MACD) indicator is turning up and volume is increasing. A break of 51 sees 51.93 as the first 1st test of resistance higher.
2. Marshall & Ilsley, Ticker: MI

Marshall & Ilsley printed a long Hammer on Friday after an extended fall. This is a bullish reversal signal. I like it to reverse up to resistance at 5.50 with further resistance at 6. Place a stop at the bottom of the hammer, at 4.93.
3. Hertz Global Holdings, Ticker: HTZ

Hertz pulled back to test the break out area near 11.50 and held. It is now heading back to 12.50, where it could meet some resistance. If it gets through 12.50 then the next resistance is at 13 and then 14. MACD and Relative Strength Index (RSI) both suggest it can go higher. Use 11.90 as a stop.
4. Campbell Soup, Ticker: CPB

Campbell Soup appears to be bottoming with both the MACD and RSI turning higher. If it can get above 34.75 then there is resistance at the 35.29-.40 area and then 35.84-.94 higher. The bottom of the consolidation channel at 34.35 is a good place for a stop.
5. Athenahealth, Ticker: ATHN

Athenahealth printed a bearish Shooting star on Thursday that was confirmed lower on Friday. Adding fuel to the short fire is that it happened at the 41.35 long term resistance/support level. Look for 40 as a first target and then 38.30 as support.
6. VirnetX, Ticker: VHC
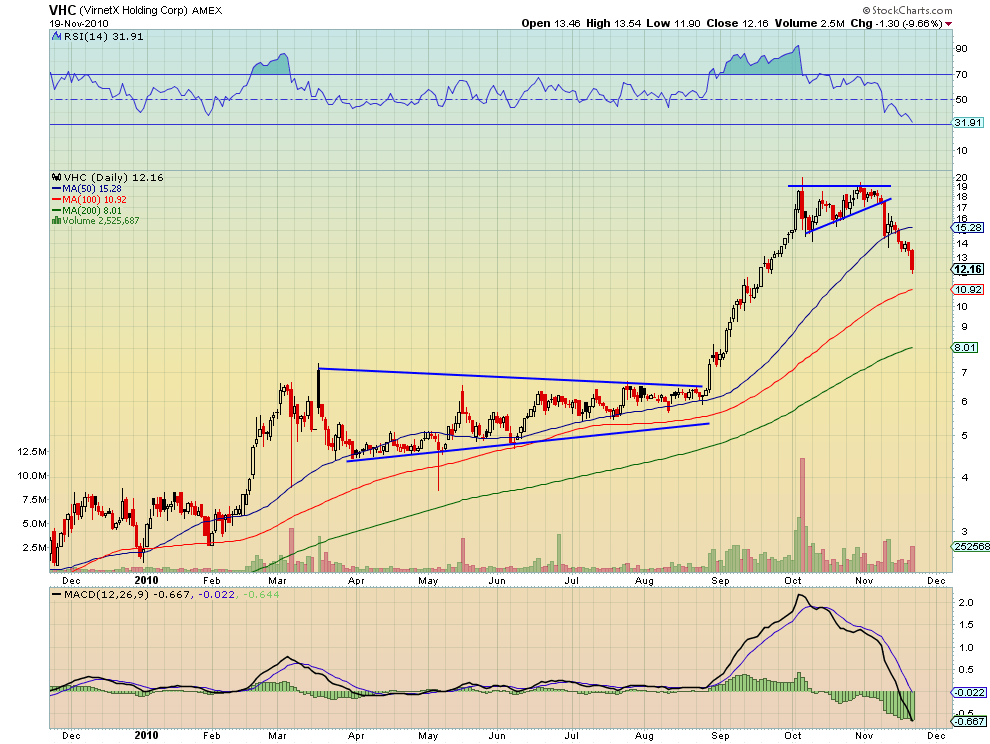
VirnetX is falling out of a bear flag with no support until 10.92. MACD and RSI are both ugly. Use 12.60 as a stop on the short.
7. NVIDIA, Ticker: NVDA
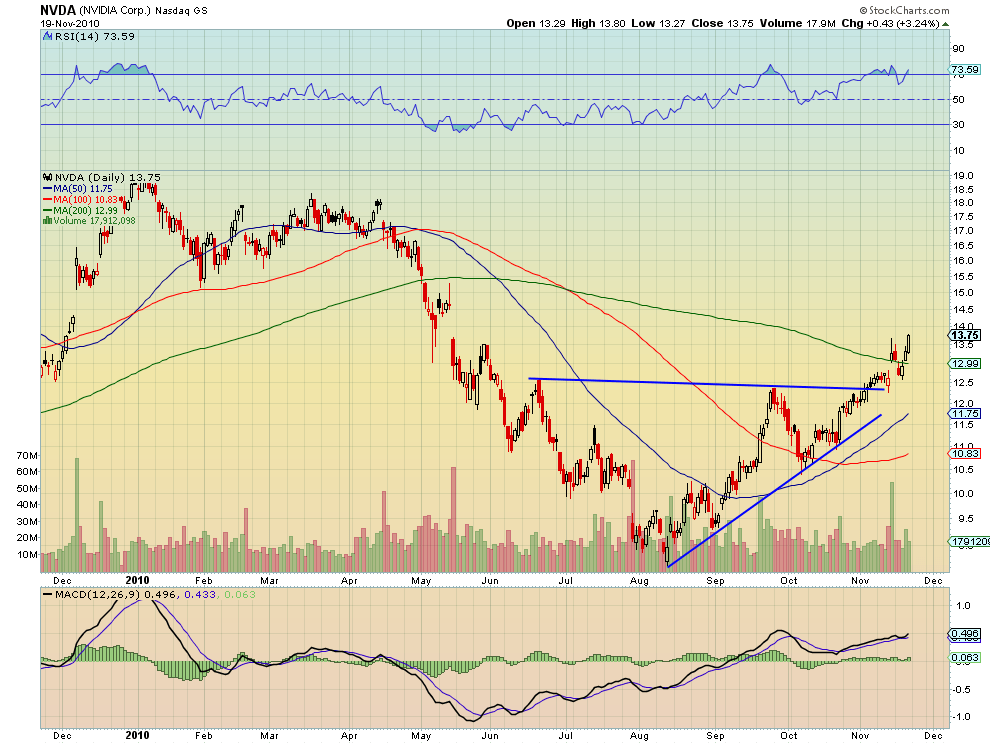
NVIDIA broke out, pulled back near the break out level and is now heading higher breaking the recent high near 13.50, a good place for a stop. It could meet resistance at 14.30 or above that at 15.30. MACD and RSI are moving higher supporting further upside.
8. United States Natural Gas, Ticker: UNG

This ETF put in a higher high and a higher low recently and is rising again. The RSI and MACD are both rising adding to the bull case. If it can hold and break above the 50 day Simple Moving Average (SMA) at 5.92 then there is resistance at 6.05. Through that it can try 6.20 and then 6.60. 5.70 would be a good place for a stop.
9. InterOil, Ticker: IOC

InterOil broke the downtrend line, retested it and held. It is now moving higher and testing the recent high near the 82.50 area. The RSI is rising and the MACD improving, adding to the bull case. It could break Monday as the two trendlines cross.
10. Energy Solutions, Ticker: ES

Energy Solutions has slowly been creeping up. The RSI is supporting a rise. Look for this stock to run to 5.67-5.70. There is good support at the SMA cross at 4.92.
Bonus Idea: RadioShack, Ticker: RSH

After a month long fall, RadioShack printed a Hammer reversal candle, on Friday. Time to stop on in, load up the truck and ride it to 20 or 20.44, above that. Friday’s low would be a good stop.
Trade’m well!
If you like what you see above sign up for deeper analysis and trading strategy by using the Get Premium button above. As always you can see details of individual charts and more on my StockTwits page.
The information in this blog post represents my own opinions and does not contain a recommendation for any particular security or investment. I or my affiliates may hold positions or other interests in securities mentioned in the Blog, please see my Disclaimer page for my full disclaimer.
blog comments powered by Disqus
-
 Gregory W. Harmon CMT, CFA, has traded since 1986 and held senior positions including Head of Global Trading, Head of Product Development, Head of Strategy and Director of Equity. (More)
 -
Subscribe to Dragonfly Capital Views
Lifetime Subscription
$4,000.00Sign upAnnual Subscription
$1,000.00Sign upQuarterly Subscription
$350.00Sign up
Recent Posts
- Bull Scan for 10-14-26
- Premium Earnings 10-13-26: Fastenal and Morgan Stanley
- Bull Scan for 10-13-26
- Premium Earnings 10-12-26: Citigroup and Johnson & Johnson
- 4 Trade Ideas Wells Fargo: Bonus Idea
- 5 Trade Ideas for Monday: AbbVie, Airbnb, Affirm, GE Aerospace and Walmart
- Top Trade Ideas for the Week of October 12, 2026: The Rest Premium
- Top Trade Ideas for the Week of October 12, 2026: The Best
- SPY Trends and Influencers October 10, 2026
- Macro Week in Review/Preview October 9, 2026
Archives