Top 10 Trade Ideas for the Week of October 4, 2010
- Posted by Greg Harmon
- on October 3rd, 2010
After looking at over 500 charts and posting my thoughts on many of them, I have found some good setups for the week. This week’s list contains 8 long ideas, 2 short setups and one breakout play. These were selected and should be viewed in the context of the broad market trend, reviewed Saturday, and monthly analysis from last week which looks to bring stronger prices for Gold and Oil with the US Dollar Index still broken and on a path lower. US Treasury Bonds are moving higher but more sideways and need a catalyst to move. The Volatility index appears tame for the time being. Equity markets seem a bit tired in shorter timeframes but more positive in the longer timeframes, so do not be surprised if there is a small pullback. Sector analysis showed that the most bullish sector was Energy, and that the Financial sector is still not participating, bringing into question how long a rally can continue. I detailed this in my review earlier today. These are intended to be quick hits. As always, you can see more here at dragonflycap.com and @harmongreg on twitter.
Here are the top ten for the week in alphabetical order:
1. CardioNet, Ticker: BEAT

The paddles brought CardioNet back from dead this week. Now it has broken out and through the 50 day Simple Moving Average (SMA) and is heading toward the next resistance at the 5.17-5.25 area from August and the gap in December 2009. Further resistance can be found above that at the 5.46-.49 area where the 100 day SMA and lows from February coincide. Support can be found from the 50 day SMA at 4.60. The rapidly rising Relative Strength Index (RSI) and growing Moving Average Convergence Divergence (MACD) indicator both support higher prices.
2. Caterpillar, Ticker: CAT
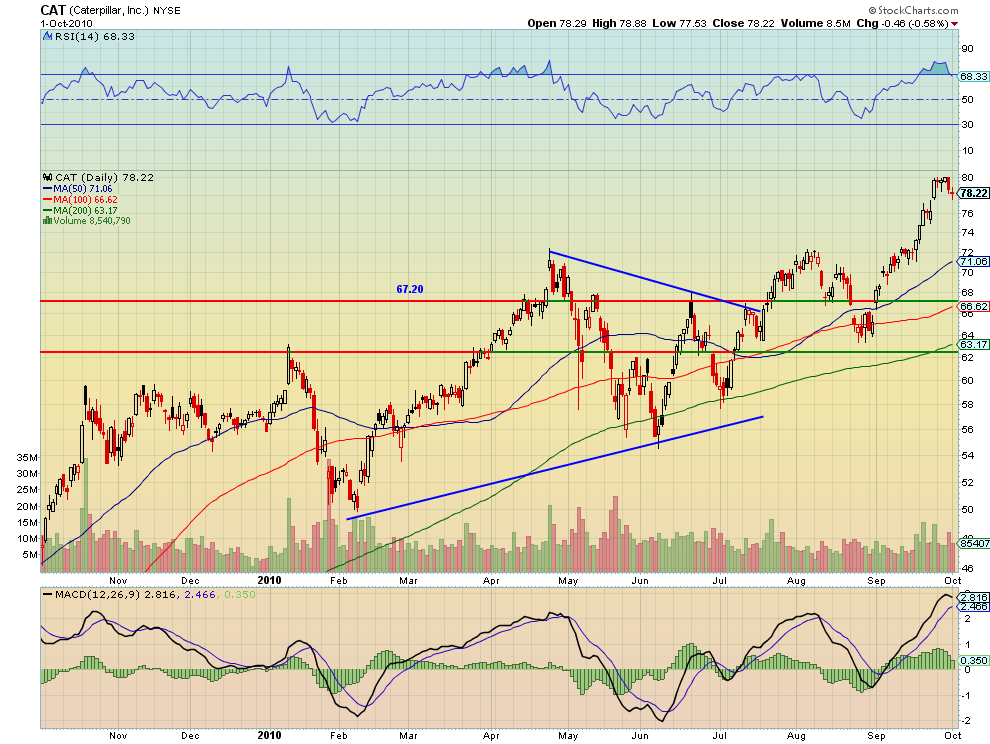
Caterpillar tested resistance at 80 resistance all week and fell on Friday, closing with a doji star near support at 78. This signals indecision or a change to come. If it loses 78 then support can be found at the 76 gap up followed by 71.06, the 50 day SMA. The rolling MACD indicator and falling RSI support a move lower after a good run.
3. Cliffs Natural Resources, Ticker: CLF
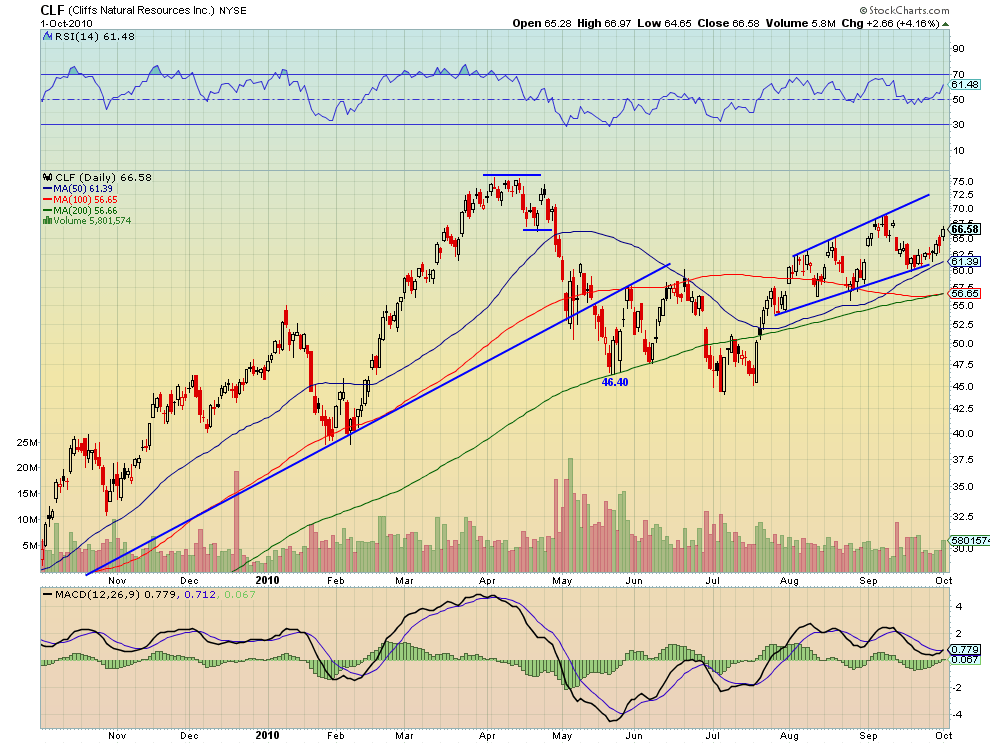
Cliffs bounced off of the support of the bottom of the rising channel at 62.50 and near the rising 50 day SMA at 61.39. It is now heading higher to resistance at 68 from early September. Above that it can test the top of the channel near 72.50. The rising MACD is about to make a bullish cross and the RSI is rising adding to the bull case.
4. Genoptix, Ticker: GXDX
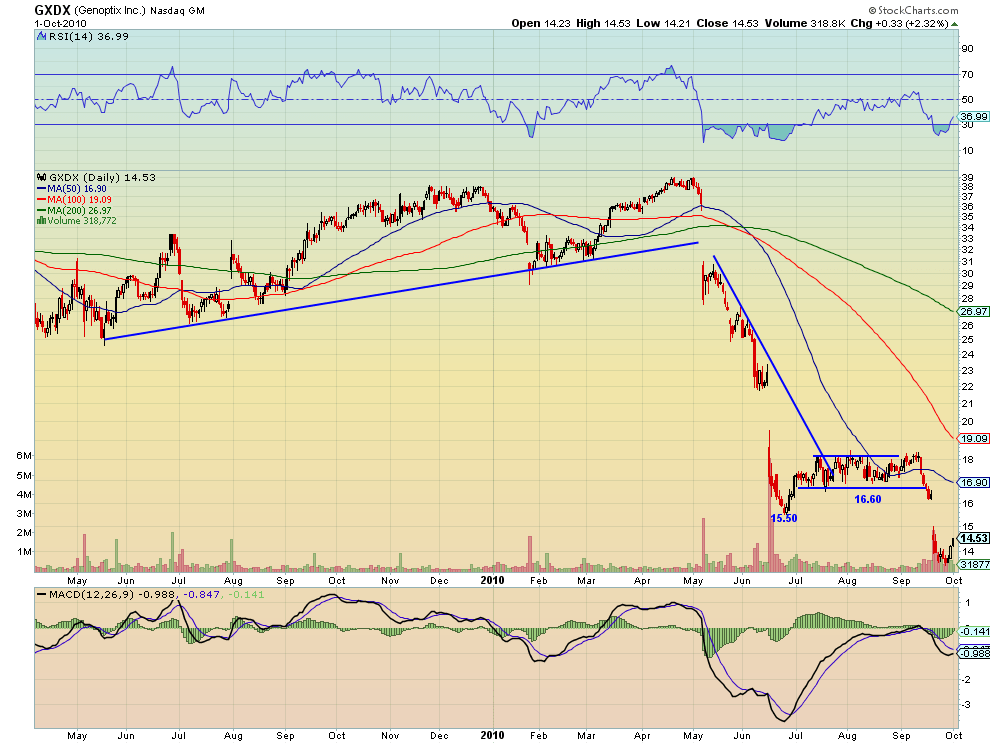
Genoptix was left for dead a few months ago and then again in mid-September. It just will not die though. It is now heading higher off of the support base at 13.75 to test the top of the gap down at 15 as resistance. If it can get through that level then the 15.50 low from June is the next resistance level followed by the channel bottom at 16.60. The MACD and RSI are both rising and support higher prices.
5. Harte-Hanks, Ticker: HHS
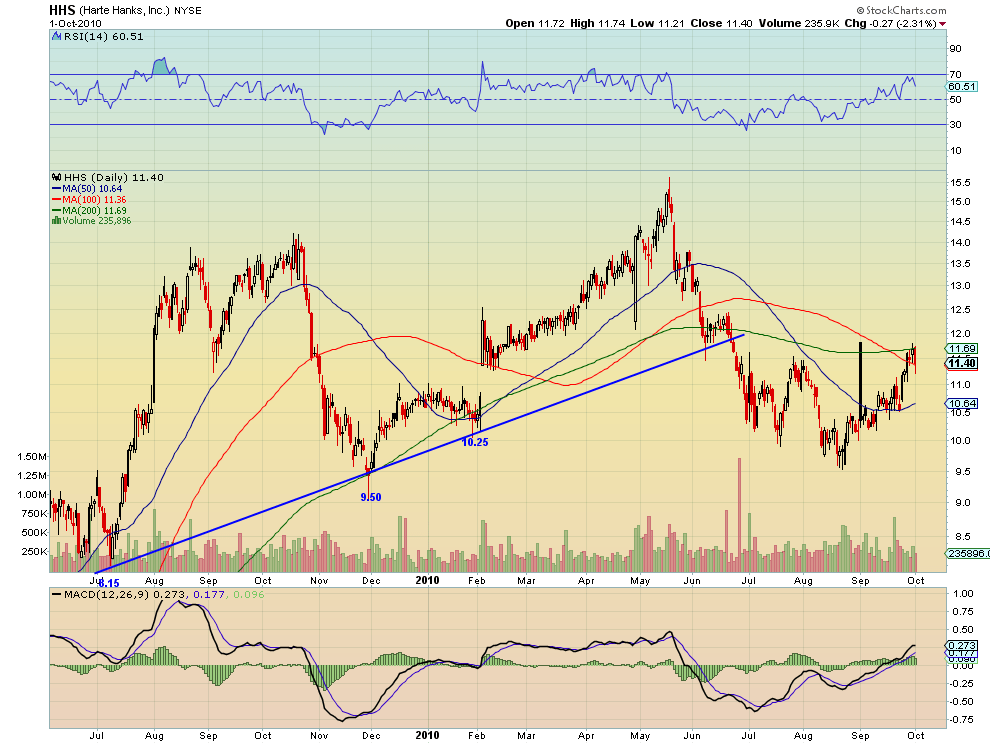
Friday Harte Hanks tested both support at 11.36 from the 100 day SMA and resistance at 11.69 from the 200 day SMA. It ended up holding above the 100 day SMA. This can be watched two ways. If it breaks above the 200 day SMA the next resistance is at 12.50 form the June highs and then the 13 area. If it breaks below the 100 day SMA then the first support area is at 10.64, the 50 day SMA.
6. 51job Inc, Ticker: JOBS

JOBS is posting a broadening flag after a great move higher from the 29 to 30 area. The bullish engulfing candle Friday may push it higher and if it gets through 39 then the expected target is 46 on a measured move looking at the lower mast of the flag from 30 to 37. There is support at 36 on the flag. If that fails then the next support is at the 29.50-30 area. The diverging volume on the rise is troublesome and suggested a pullback could come. Although volume is higher over the last 3 months relatively than it has been, it is a pretty thinly traded stock so positions must be small.
7. Mastercard, Ticker: MA
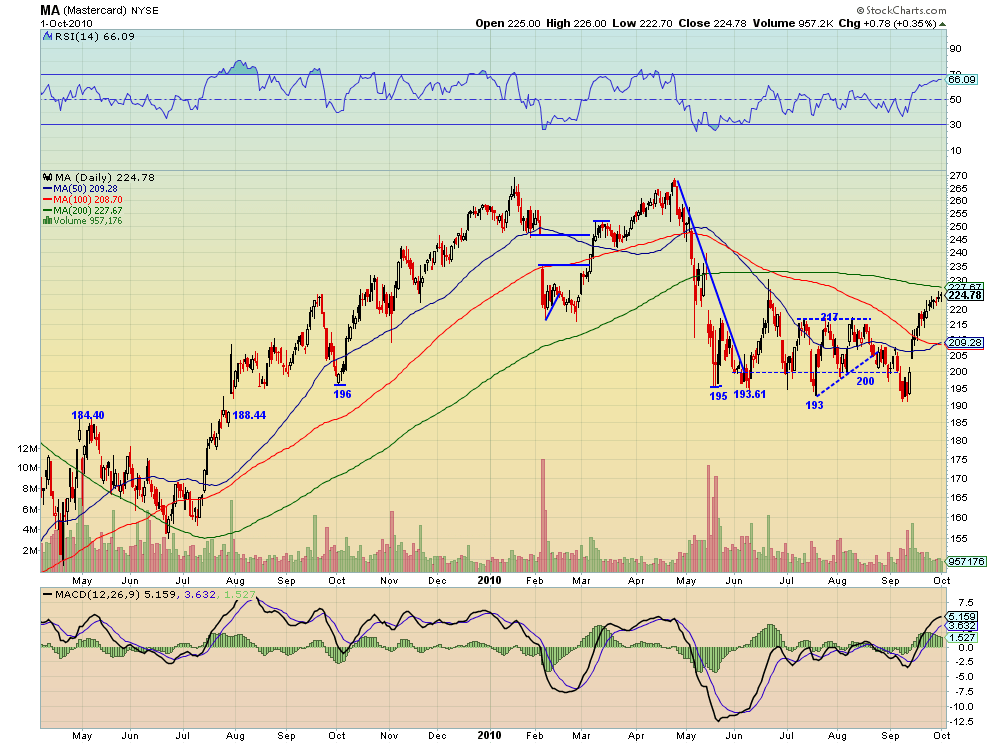
Mastercard is easing into the resistance of the 200 day SMA at 227.67 as if it is an asymptote. The MACD is waning and starting to turn suggesting that it may give way at resistance. If so then support below is at 217 and then the 50/100 SMA cross at 208.70-209.28.
8. Patriot Coal, Ticker: PCX

Patriot Coal broke the 50 day SMA at 11.51 on stronger relative volume and is headed to resistance of 12 from August and September. If it can get through 12 then the next resistance is at the 100 day SMA at 13.06 followed by the lows at 14 from February and May. The 50 day SMA will be support now and the base at 11 below that.
9. Pre-Paid Legal Services, Ticker: PPD
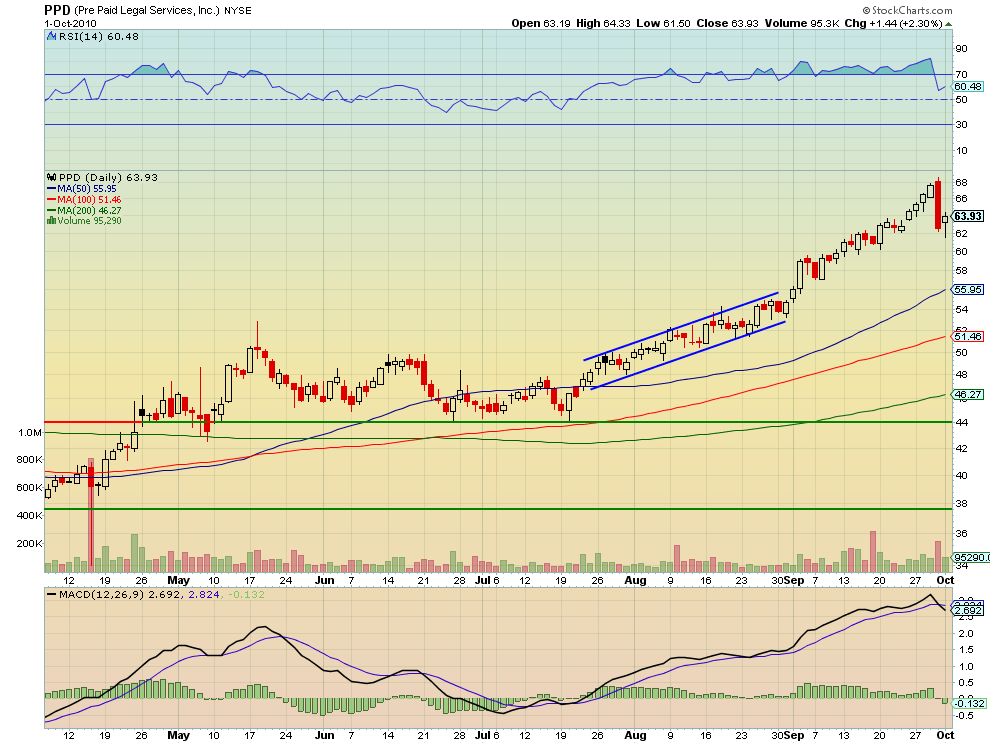
Pre Paid Legal printed a bullish Hammer on Friday after a big down day Thursday, both of which tested and held the support area at 62. If it continues to hold then it can try resistance at 68 from the run up. The MACD is still decreasing so a tight stop or confirmation of a hold at 62 is prudent. Support below 62 comes at 60 and 59 from the run up and then 55.95, the 50 day SMA. Volume is pretty light in this stock so small size.
10. Sequenom, Ticker: SQNM
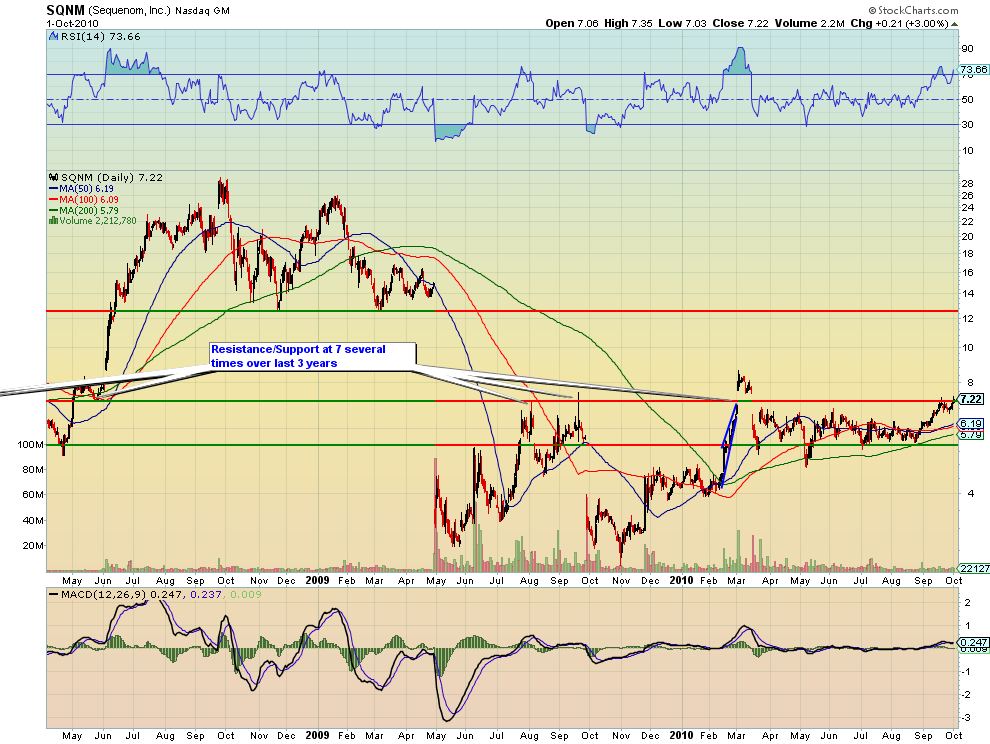
Sequenom has been in a channel most of the year and is breaking out higher above the top bound at 7 now. This will become support. It is now headed to resistance at 8 and then 8.50 from the failed break out in March. If it can get through then the next resistance is at 12.50. Should the breakout fail again then support can be found below at 6..09-19, the 100 and 50 day SMA’s.
Bonus Idea: Citgroup, Ticker: C

Citigroup broke out higher with strong relative volume on Friday, driving through several resistance levels. There is now resistance at 4.20 and then the two long term support/resistance lines at 4.30 and 4.42 higher. The RSI is rising and the MACD growing adding to the bull case. Should the price retrace the first support area is at 4 followed by the 50 and 100 day SMA’s at 3.92.
Trade’m well this week!
If you like what you see above sign up for deeper analysis and trading strategy by using the Get Premium button above. As always you can see details of individual charts and more on my StockTwits page.
The information in this blog post represents my own opinions and does not contain a recommendation for any particular security or investment. I or my affiliates may hold positions or other interests in securities mentioned in the Blog, please see my Disclaimer page for my full disclaimer.
blog comments powered by Disqus
-
 Gregory W. Harmon CMT, CFA, has traded since 1986 and held senior positions including Head of Global Trading, Head of Product Development, Head of Strategy and Director of Equity. (More)
 -
Subscribe to Dragonfly Capital Views
Lifetime Subscription
$4,000.00Sign upAnnual Subscription
$1,000.00Sign upQuarterly Subscription
$350.00Sign up
Recent Posts
- Bull Scan for 10-14-26
- Premium Earnings 10-13-26: Fastenal and Morgan Stanley
- Bull Scan for 10-13-26
- Premium Earnings 10-12-26: Citigroup and Johnson & Johnson
- 4 Trade Ideas Wells Fargo: Bonus Idea
- 5 Trade Ideas for Monday: AbbVie, Airbnb, Affirm, GE Aerospace and Walmart
- Top Trade Ideas for the Week of October 12, 2026: The Rest Premium
- Top Trade Ideas for the Week of October 12, 2026: The Best
- SPY Trends and Influencers October 10, 2026
- Macro Week in Review/Preview October 9, 2026
Archives