Top 10 Trade Ideas for the Week of October 25, 2010
- Posted by Greg Harmon
- on October 24th, 2010
After looking at over 500 charts and posting my thoughts on many of them, I have found some good setups for the week. This week’s list contains 7 long ideas, 2 short setups and two breakout plays. These were selected and should be viewed in the context of the broad market trend, reviewed Friday, which looks to bring weaker prices for Gold and a continued rise in the US Dollar Index. US Treasury Bonds look to move lower as Oil consolidates in a range waiting for a catalyst. Emerging markets look to move higher but may have some short term resistance. A steady and relatively low volatility index should just be a innocent bystander. The equity markets look like they may pause or retreat slightly in the short term but are poised to move higher long term.
(As always you can see these individual charts and more on my twitter feed and on chartly.)
Here are the top ten for the week in alphabetical order:
1. A123 Systems, Ticker: AONE
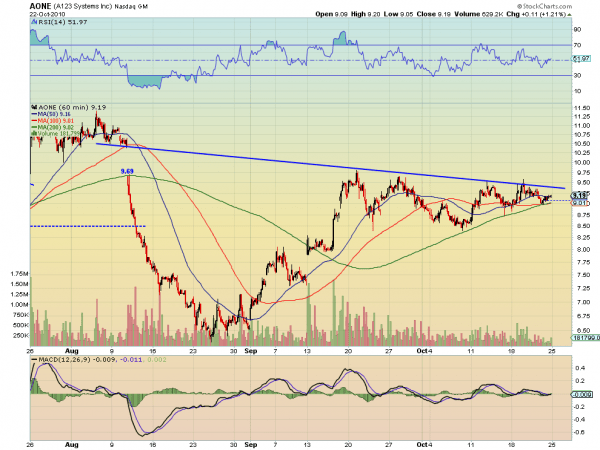
A123 Systems is in a symmetrical triangle in this hourly chart, between the downtrend from the gap area in August and the 200 hour Simple moving Average (SMA) which as been support for the last two weeks. If it can break above the trend line at 9.40 there is resistance at 9.70 followed by 10.46. On the contrary side, if it falls below 9.00 there is support at 8.50 followed by 8.00. Watch the price action and be ready either way. A win-win either way.
2. ATP Oil and Gas, Ticker: ATPG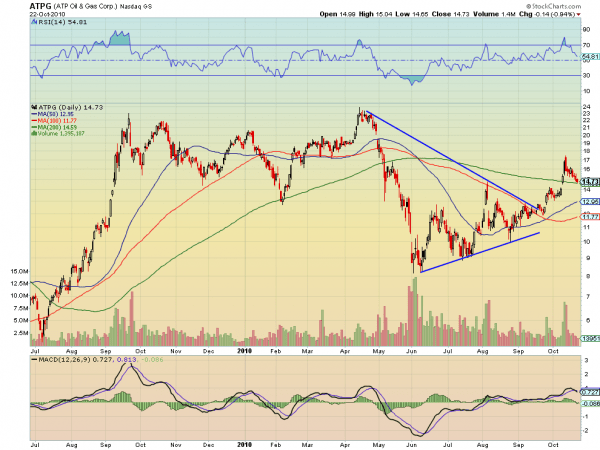
ATP Oil broke out of a symmetrical triangle in late September and has moved higher. It is currently pulling back and is near the 200 day SMA at 14.59. What happens when it finds 14.59 is the key to this idea. If it bounces it will see resistance at 16 and then 17.5 higher. If the 200 day SMA fails to support it then there is support lower at the 14.05 gap followed by 12.95. The falling Relative Strength Index (RSI) and Moving Average Convergence Divergence (MACD) indicator suggest that it might fail to hold support but watch 14.59 and act upon what it tells you.
3. Yingli Green Energy, Ticker: YGE

Yingli Green Energy has been in a Bear flag near the 50/200 day SMA cross after falling from 14. If it falls under the 100 day SMA at 11.41 the next support level is at at 10. The negative MACD and falling RSI give it a chance.
4. Marshall & Ilsley, Ticker: MI
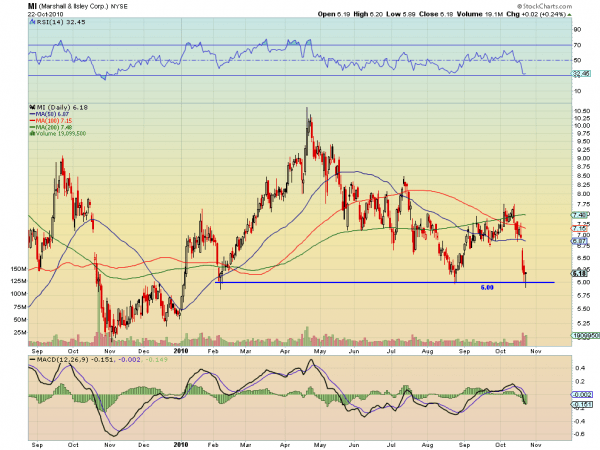
Marshall and Ilsley lost support of the 50 day SMA last week and fell to longer term support at 6. It held support at 6 Friday and printed a bullish dragonfly doji reversal candle. It will now see resistance at 6.71 followed by a gap fill to 6.87. Get on the bus.
5. Biogen Idec, Ticker: BIIB

Biogen Idec is testing the top of a rising wedge. If it can get through 59 there is resistance at 60 from march and then a target of then 63.
6. RINO International, Ticker: RINO

RINO International broke through the 200 day SMA , retested it, and his heading higher again to test the 18.45 support/resistance area. If it gets through 18.45 then the next resistance is near 20 with 22 after that.
7. Cabela’s, Ticker: CAB
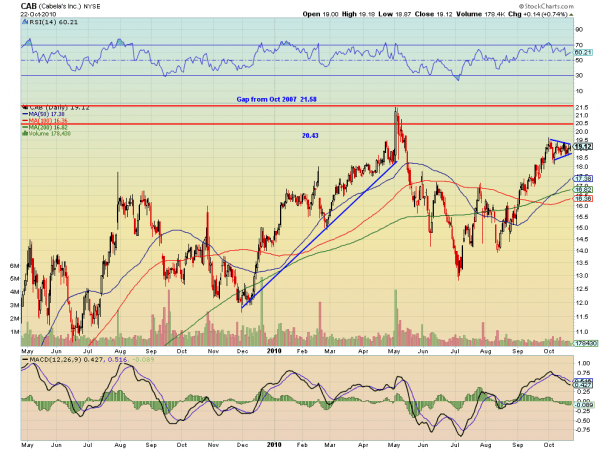
Cabela’s is posting a Bull flag after moving higher throughout September. If it can break out higher above 19.5 then resistance comes at 20.43 and then 21.58. A full measured move would give a target of 22.25. Should it fail and fall under 18.50 then support is found at 17.38. I like it to the upside based on the RSI being high and the MACD moving closer to the zero line.
8. Select Comfort, Ticker: SCSS

Select Comfort is moving higher to some resistance at 8.5 with stronger resistance at 9 above it and 9.80 after that. Recent activity would put further upside to 10.50 above that. Support is at 7.97.
9. Expedia, Ticker: EXPE

Expedia has been running and then flagging its way higher. To start trh next move up it needs to get through 28.50 and then 29.50. if this happens the target on the move is 33. A break of 28.50 is the entry.
10. MIPS Technologies, Ticker: MIPS

MIPS Technologies broke through the 10.10 resistance area from 2007, retested it and is moving up. If it can get through 10.50 then the target is 13 on a measured move. The MACD is turning up adding support to an upside move.
Bonus Idea: Bank of America, Ticker: BAC

I have put up several charts on bank of America since it broke 11.80. To the left of the chart there is some congestion until it gets down to 10.50. If it gets through the 10.50 level then the next support level is at 9.30.
Trade’m well!
If you like what you see above sign up for deeper analysis and trading strategy by using the Get Premium button above. As always you can see details of individual charts and more on my StockTwits page.
The information in this blog post represents my own opinions and does not contain a recommendation for any particular security or investment. I or my affiliates may hold positions or other interests in securities mentioned in the Blog, please see my Disclaimer page for my full disclaimer.
blog comments powered by Disqus
-
 Gregory W. Harmon CMT, CFA, has traded since 1986 and held senior positions including Head of Global Trading, Head of Product Development, Head of Strategy and Director of Equity. (More)
 -
Subscribe to Dragonfly Capital Views
Lifetime Subscription
$4,000.00Sign upAnnual Subscription
$1,000.00Sign upQuarterly Subscription
$350.00Sign up
Recent Posts
- Bull Scan for 10-14-26
- Premium Earnings 10-13-26: Fastenal and Morgan Stanley
- Bull Scan for 10-13-26
- Premium Earnings 10-12-26: Citigroup and Johnson & Johnson
- 4 Trade Ideas Wells Fargo: Bonus Idea
- 5 Trade Ideas for Monday: AbbVie, Airbnb, Affirm, GE Aerospace and Walmart
- Top Trade Ideas for the Week of October 12, 2026: The Rest Premium
- Top Trade Ideas for the Week of October 12, 2026: The Best
- SPY Trends and Influencers October 10, 2026
- Macro Week in Review/Preview October 9, 2026
Archives