Top 10 Trade Ideas for the Week of November 1, 2010
- Posted by Greg Harmon
- on October 31st, 2010
After looking at over 500 charts and posting my thoughts on many of them, I have found some good setups for the week. This week’s list contains 8 long ideas, 1 short setup and two breakout plays. These were selected and should be viewed in the context of the broad market daily and weekly trend, reviewed Friday, which looks to bring a continued rise in the price for Gold. Crude Oil and the US Dollar Index will be looking for a catalyst to move out of their recent ranges. US Treasury Bonds look to continue lower as emerging market move higher. Volatility may be making a comeback which could stall the equity markets which look good and still in their uptrends with the QQQQ a strong leader.
The longer term monthly macro view heading into November looks positive for Gold, and the emerging markets. US Treasuries are in a flag testing the downside. Crude Oil is is also in a flag but not giving any clues of its next direction. The US Dollar Index appears to be headed lower. The SPY, IWM and QQQQ all look good for more upside on a monthly basis, but with close attention to the diverging volume.
Sector Analysis shows two concepts. First, the market in general as measured by the SPDR Select Sector funds looks more bullish the longer the timeframe used, with the monthly charts the most bullish, the weekly slightly less and the daily even less so confirming the macro view. Second, one sector, Consumer Staples, XLP, shows up in the top tier of each timeframe and gets support from Technology, XLK and Consumer Discretionary, XLY on the shorter timeframes. There is also one sector that shows up as the worst on all timeframes, Financials, XLF. Do your own homework but use this information to your advantage.
(As always you can see these individual charts and more on my twitter feed and on chartly.)
Here are the top ten for the week in alphabetical order:
1. Atwood Oceanics, Ticker: ATW
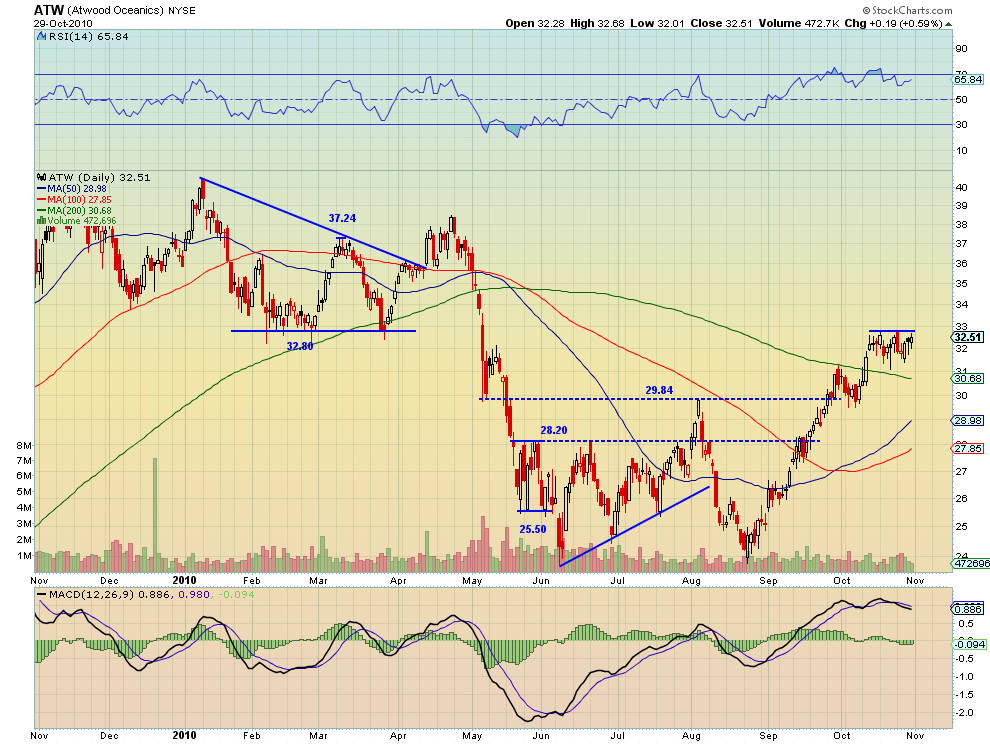
Atwood Oceanics has been trying to raise the roof at 32.80 for a few weeks. You will notice that this level has also been support in February and April, so it is a very important level. If it can get above 32.80 then it can run to 34.10 and higher before meeting resistance near 37.25. Don’t hold it below 31.50.
2. Caterpillar, Ticker: CAT
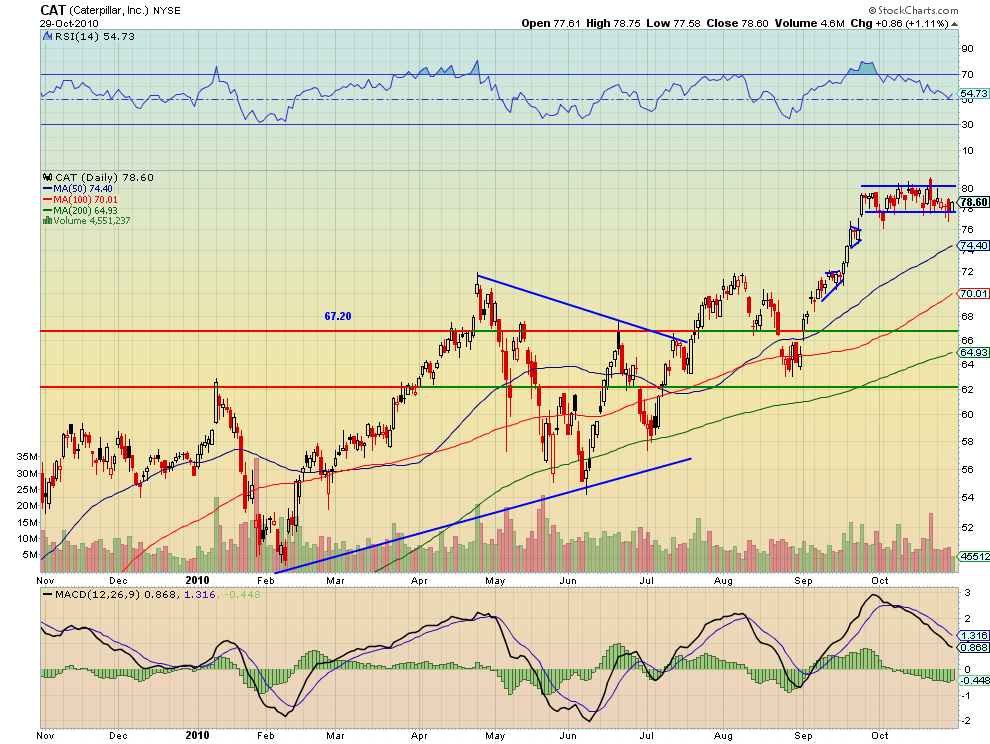
I have been watching this bull flag in Caterpillar for a couple of weeks waiting for a break out. If it breaks to the upside then a measured move would put the target near 93. A fall below the flag could test 74.40 the 50 day Simple Moving Average (SMA). The turn in the Moving Average Convergence Divergence (MACD) indicator and the Relative Strength Index (RSI) suggest the break will be higher.
3. Cost Plus, Ticker: CPWM
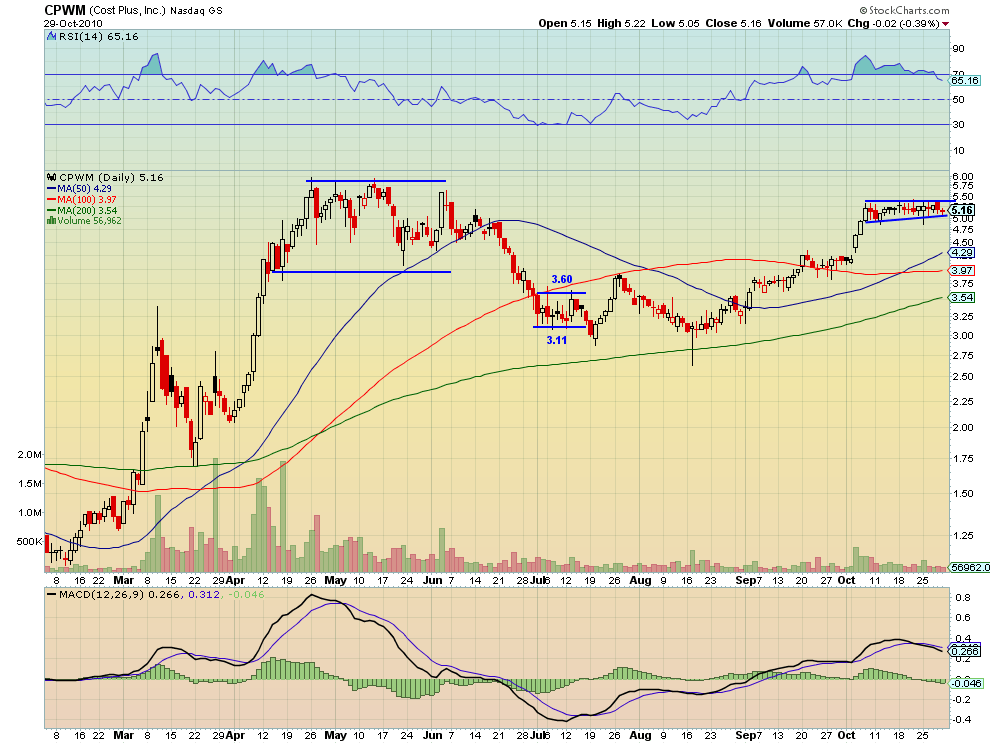
Cost Plus has been in a bull flag for a few weeks also. if this one breaks the flag higher, above 5.4, then it will see resistance at 5.90 and a target of 6.65. If it breaks the flag lower under 5.00, then there is support at 4.25-.29. The RSI and MACD are both falling but the SMA’s rising so watch both ways and play what it gives you.
4. Hain Celestial, Ticker: HAIN
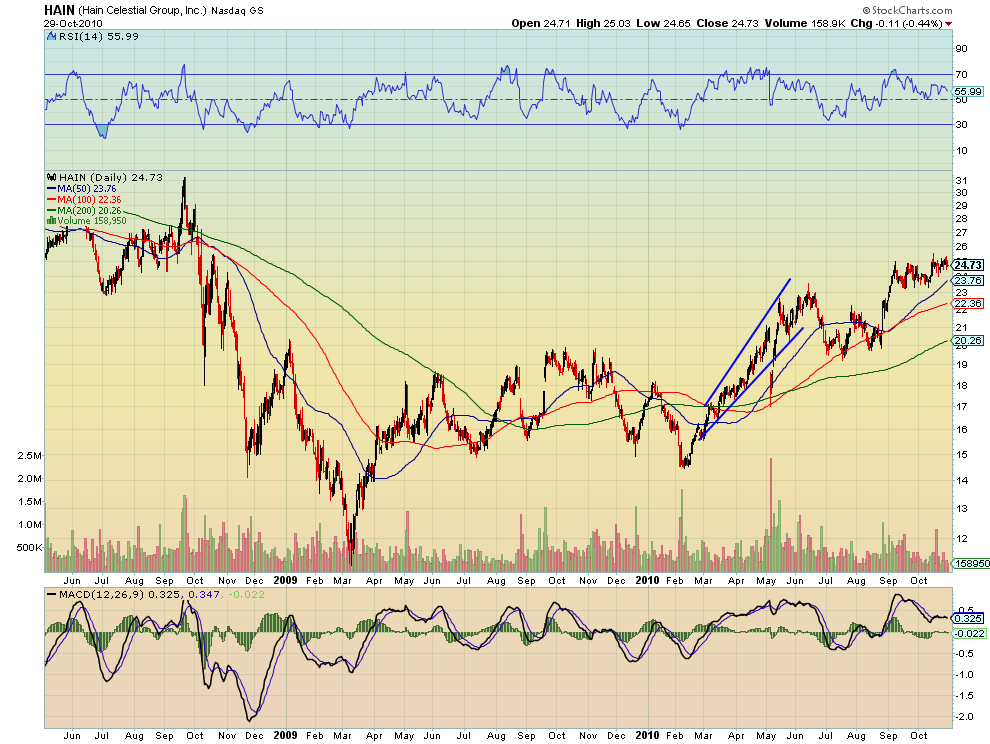
Yet another bull flag for Hain Celestial, only longer and broader. If this can get above 25.20 then there is resistance at 27 first followed by 29 and then 31. the measured move from the flag would be near 29. The 50 day SMA at 23.76 provides the downside support below the flag.
5. Jet Blue, Ticker: JBLU

JetBlue broke out of a long ascending triangle and on Friday retested the break out level at 6.90. if it continues to hold then it will see resistance at 7.20, where the initial break out stalled, before heading to the measured move target of 9.90.
6. MedQuist, Ticker: MEDQ
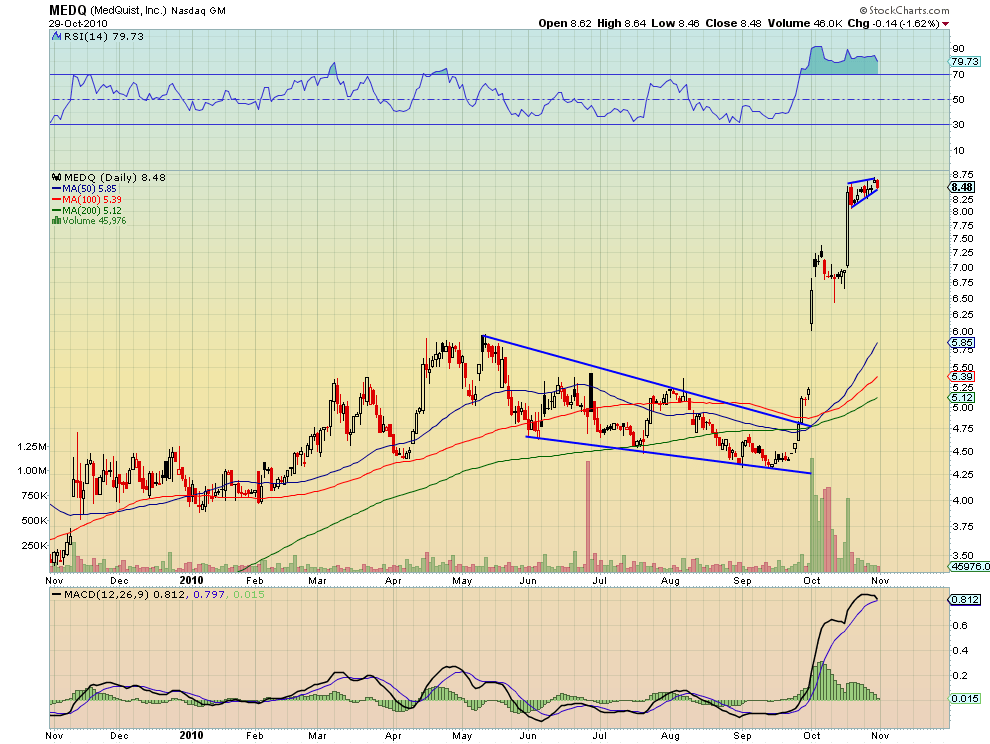
MedQuist has been in a short flag after rising from its previous bull flag. If it breaks higher above 8.75 then a new target of 10.50 will be established. If it falls below support at 8.00, supp at 8.10 then it can fall to 7.25 quickly. The falling RSI and MACD as well as the upward tilt to the flag suggest the break may be down. Watch and play what it gives you.
7. Mellanox Technologies, Ticker: MLNX

Mellanox gapped up on Thursday, tested and held on Friday. An open above 22.00 would be a buy signal with a target of 25.25 initially and then 26 or possibly 27. The MACD is building and the RSI is rising adding to the potential for a further move.
8. Micron Technology, Ticker: MU

Micron gapped up on strong volume on Friday. If it can hold at 8.12, it can run to 8.71 and more. The MACD and RSI are both rising and supporting a further move.
9. Sunstone Hotel Investors, Ticker: SHO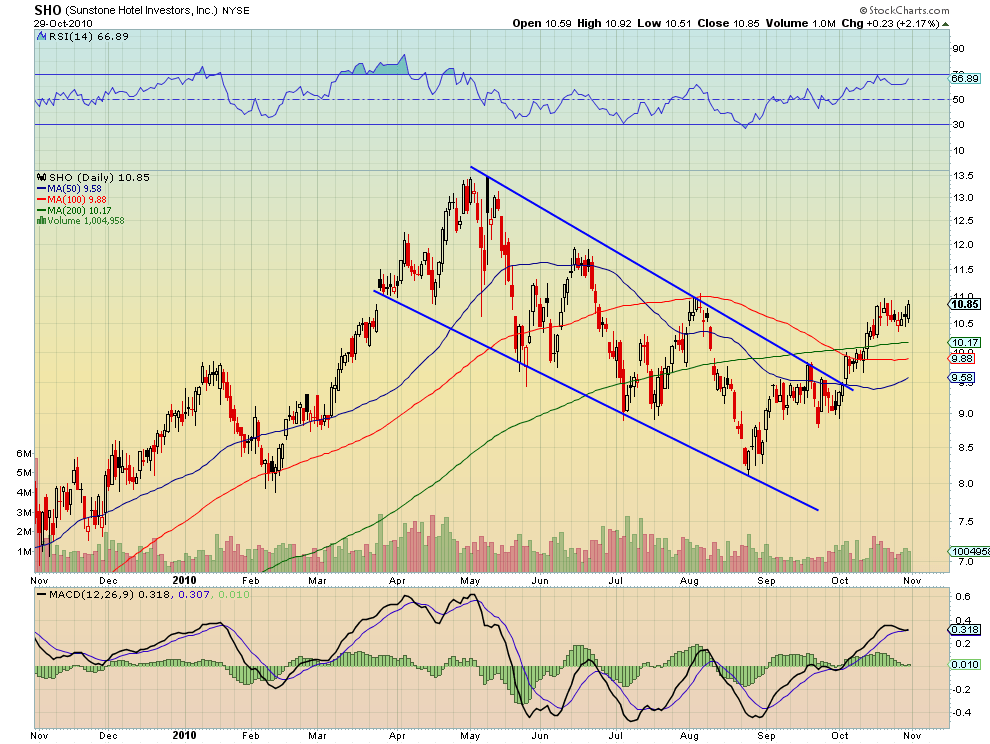
Sunstone Hotels broke out of a descending channel a couple of weeks ago and is now in a bull flag between 10.50 and 11.00. If it can get above 11 then there is resistance at 11.85 followed by 13.00. Both the MACD and RSI are bouncing and heading higher supporting the possibility of another move higher.
10. Yingli Green Energy Holding, Ticker: YGE
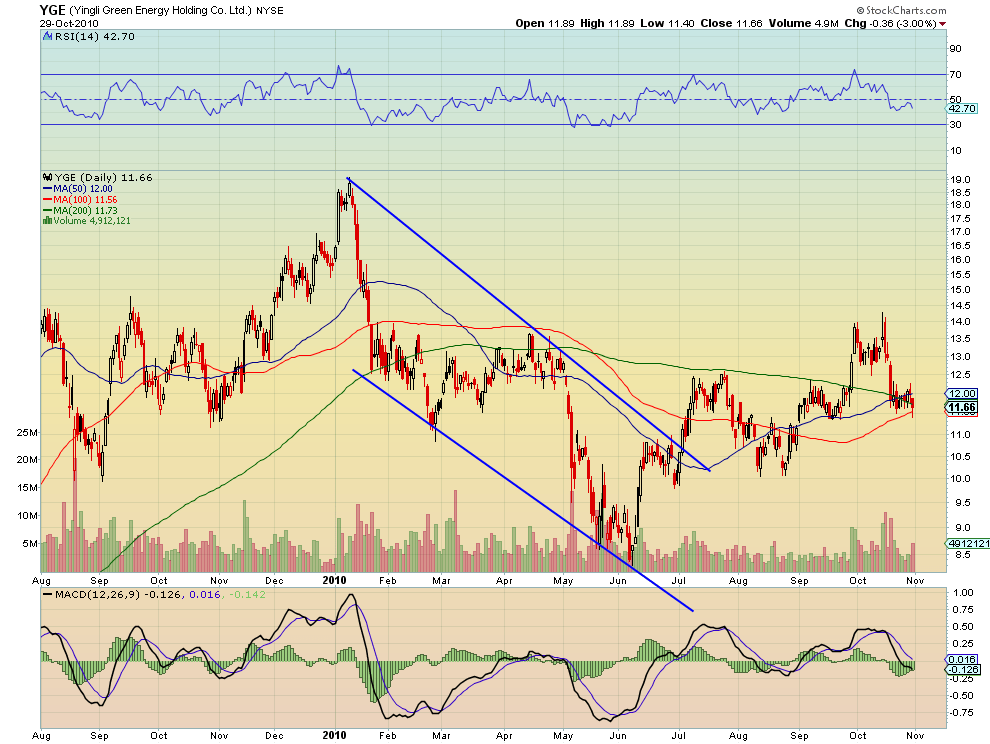
Yingli Green Energy has been in a bear flag and probed under it on Friday. If it can break below 11.40, support from September, there is space to fall to 10.00. Use 11.73, the 200 day SMA, as a stop.
Bonus Idea: Blackstone Group, Ticker: BX
I have been trying to avoid all the financial names in the hope that if I do then maybe they will move, one way or another, but Blackstone is making me take notice. It has been holding 13.25 support in a bull flag for a couple of weeks. This past week the RSI and MACD both started to improve. If this keeps up and it can break through the top of the flag at 13.75 then it will not meet resistance until 14.85.
Trade’m well!
If you like what you see above sign up for deeper analysis and trading strategy by using the Get Premium button above. As always you can see details of individual charts and more on my StockTwits page.
The information in this blog post represents my own opinions and does not contain a recommendation for any particular security or investment. I or my affiliates may hold positions or other interests in securities mentioned in the Blog, please see my Disclaimer page for my full disclaimer.
blog comments powered by Disqus
-
 Gregory W. Harmon CMT, CFA, has traded since 1986 and held senior positions including Head of Global Trading, Head of Product Development, Head of Strategy and Director of Equity. (More)
 -
Subscribe to Dragonfly Capital Views
Lifetime Subscription
$4,000.00Sign upAnnual Subscription
$1,000.00Sign upQuarterly Subscription
$350.00Sign up
Recent Posts
- Bull Scan for 10-14-26
- Premium Earnings 10-13-26: Fastenal and Morgan Stanley
- Bull Scan for 10-13-26
- Premium Earnings 10-12-26: Citigroup and Johnson & Johnson
- 4 Trade Ideas Wells Fargo: Bonus Idea
- 5 Trade Ideas for Monday: AbbVie, Airbnb, Affirm, GE Aerospace and Walmart
- Top Trade Ideas for the Week of October 12, 2026: The Rest Premium
- Top Trade Ideas for the Week of October 12, 2026: The Best
- SPY Trends and Influencers October 10, 2026
- Macro Week in Review/Preview October 9, 2026
Archives