Top 10 Trade Ideas for the Week of December 6, 2010
- Posted by Greg Harmon
- on December 5th, 2010
After looking at over 500 charts and posting my thoughts on many of them, I have found some good setups for the week. This week’s list contains 8 long ideas, one short set up and 2 plays that could go either way. These were selected and should be viewed in the context of the broad market daily and weekly trend, reviewed Saturday, which looks for next week to bring higher prices for Gold and Crude Oil and further weakness from the US Dollar Index and US Treasuries. The direction of the Volatility Index break out may determine the speed of the next leg up in equities. US and Emerging markets are already moving. The Chinese market may move lower before it can recover if it fails on the weekly chart. From the Sector Review the best sectors continue to be the Energy and Consumer Discretionary and Materials sectors and the worst Financials. Although all sectors helped out last week.
(As always you can see details of these individual charts and more on my twitter feed and on chartly.)
Here are the top ten for the week in alphabetical order:
1. American Capital, Ticker: ACAS
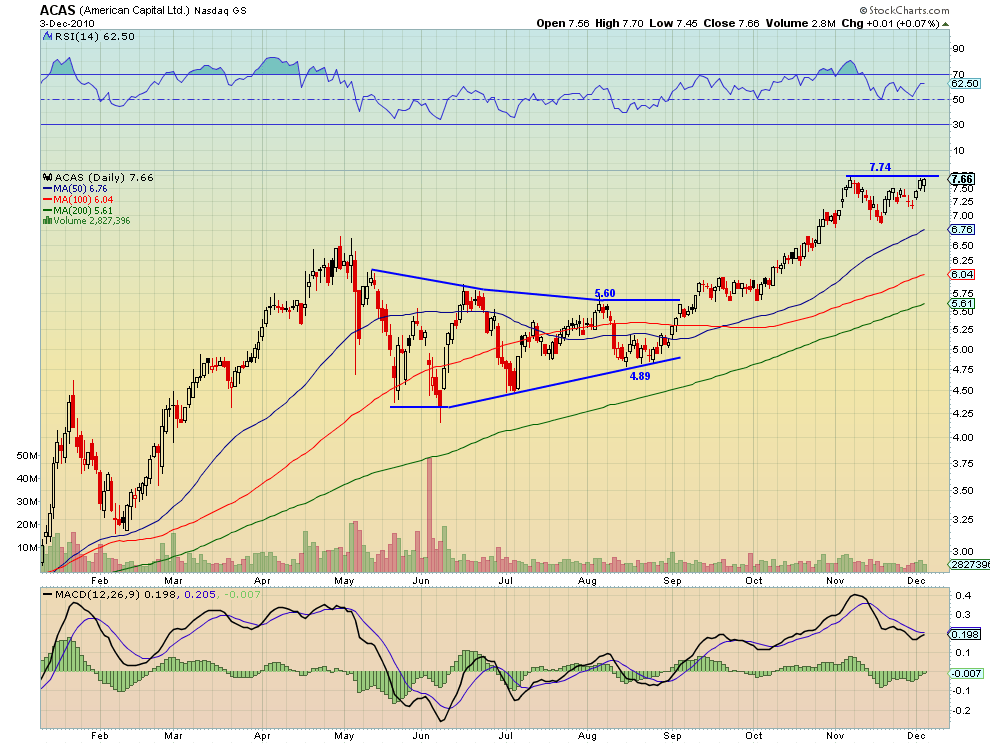
American Capital is knocking on the door at resistance of 7.74 for the second time. If it can get above 7.74 then look for a target of 8.75. The rising Moving Average Convergence Divergence (MACD) indicator and Relative Strength Index (RSI) give it a chance. Additionally the support of a higher lower is positive. First support can be found at 7.50.
2. AsiaInfo-Linkage, Ticker: ASIA
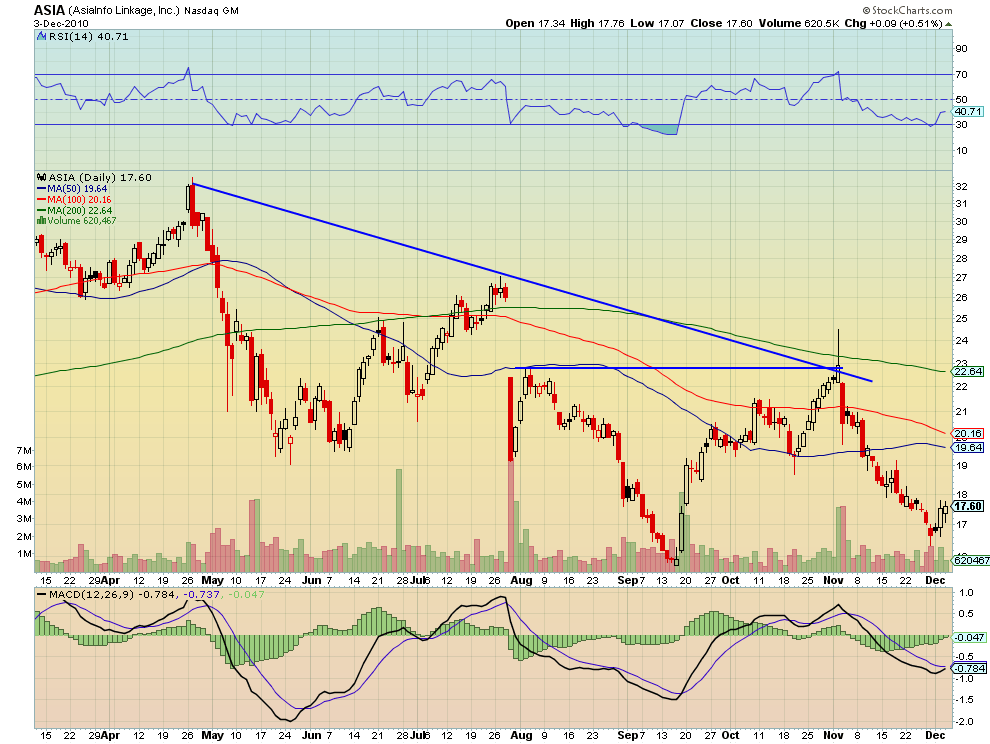
AsiaInfo-Linkage had a good bounce off of support in the high 16’s and is now heading higher to resistance at 18. If it can get through 18 then 19 and 19.64 are the next resistance levels. The MACD cross and rising RSI add support to higher prices.
3. Athenahealth, Ticker: ATHN

Athenahealth broke resistance at 41.35 last week and retested the level, holding it twice. If it continues to hold then the next resistance level is at 43.75 followed by 46.46 and 47.80 higher. The recent MACD cross is supportive, and with RSI pulled back slightly it also has some room higher.
4. CEMEX, Ticker: CX

CEMEX is in a symmetrical triangle within a symmetrical triangle. If it can break higher above 9.80 then there is resistance at 10 and 11 before the target level of 13.50. There is support at 9.54 from the 200 day SMA and then the 20day SMA at 9.30 coinciding with the 9.25 historical level. The MACD is improving and the RSI rising.
5. DiamondRock Hospitality, Ticker: DRH

DiamondRock is testing resistance of the top of an ascending triangle at 11.10. If it can break above it then there is resistance at 11.77 above before a target of 12.75. Again a rising MACD and RSI support a move higher.
6. Cheniere Energy, Ticker: LNG

Cheniere Energy is in a Bull flag but it looks suspect. The MACD is turning negative and RSI falling fast. Should it lose the flag lower, under 5.40, then there is support at 5 followed by 4.5 and then 3.79. If it can gain strength and break the flag higher above 6 then there is resistance at 6.5 and a target for the pattern would be 7.75-8.
7. MGM Resorts, Ticker: MGM
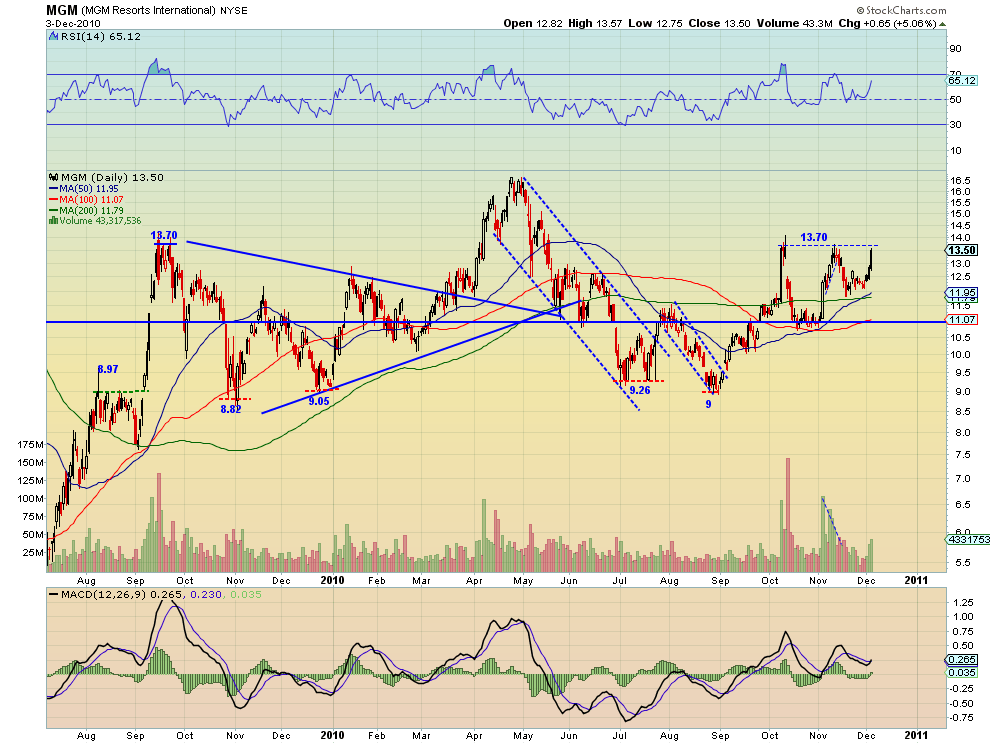
MGM Resorts is knocking on the ceiling at 13.70 for the third time in two months. Each time from a higher low. If it can get through then it encounters resistance at 14.76 followed by 15.87 and then 16.71 higher. The RSI is rising and the MACD improving. I’m betting on the third time being a charm.
8. Magnum Hunter Resources, Ticker: MHR

Magnum Hunter is also in a Bull flag that is looking tired. The probe lower Friday is troubling, coupled with a weakening MACD and fast falling RSI. If it breaks lower under 5.85 then there is support at 4.96. Should the flag hold and price continue higher then above 6.25 I would look for 7.25 as a target.
9. Research In Motion, Ticker: RIMM
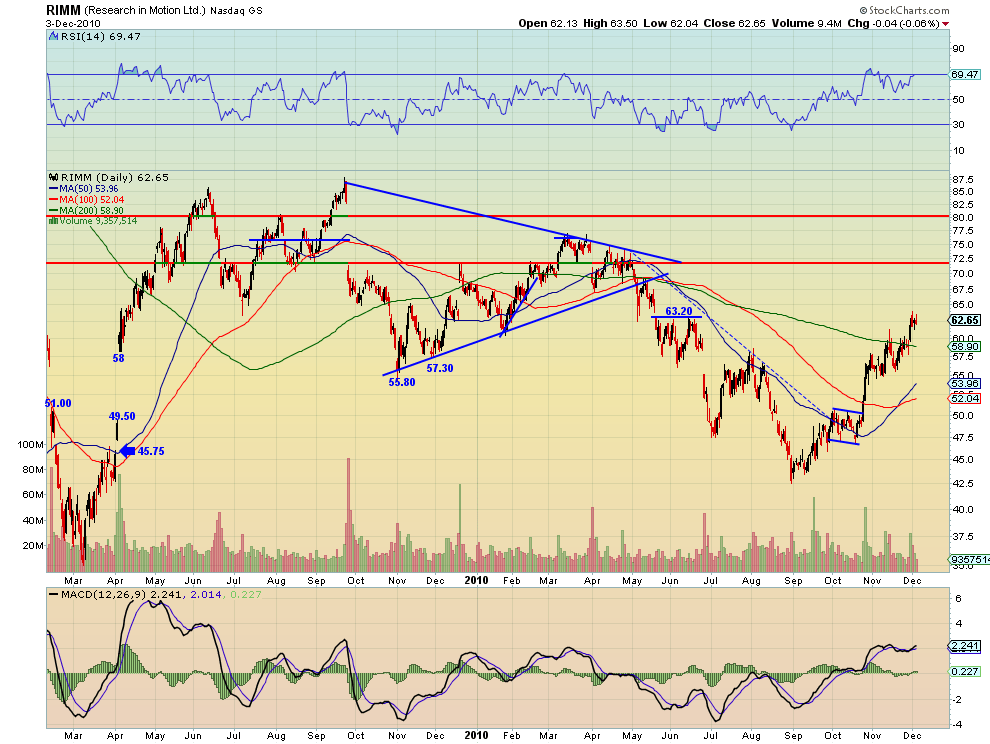
RIMMis charging back after being written off as dead from a poisoned Apple. It is currently flagging higher after a break off of the 200 day Simple Moving Average (SMA). If it can get through 63.20 then it is going to 72. The improving MACD will assist it.
10. Seattle Genetics, Ticker: SGEN
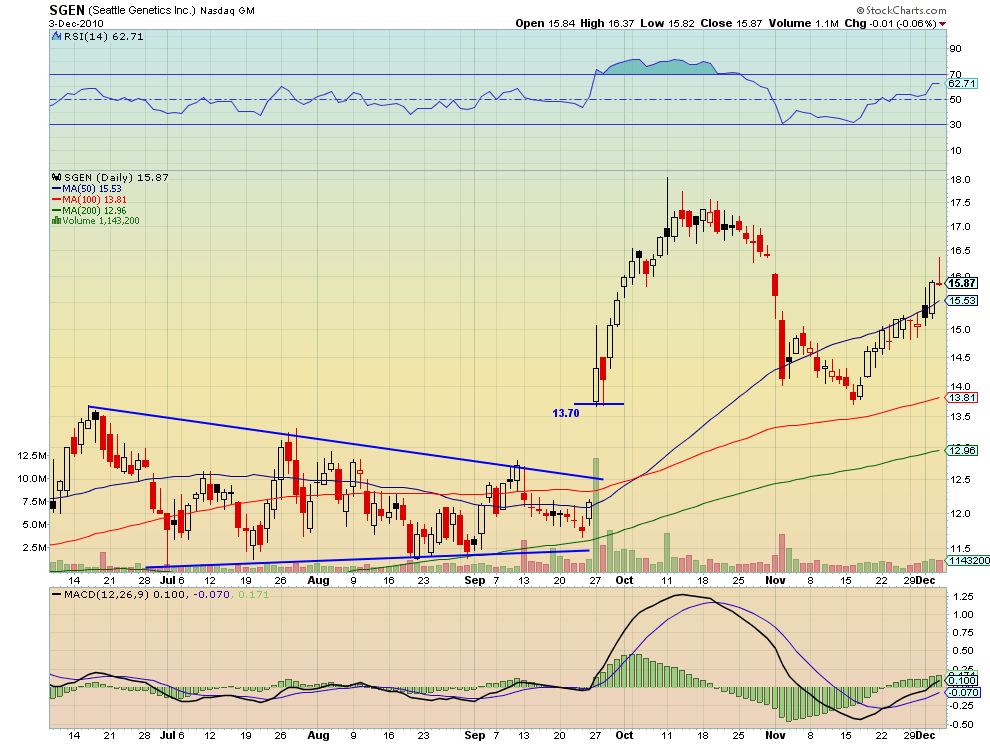
Seattle Genetics printed a very bearish Gravestone Doji on Friday. There is support lower at 15.53 followed by 15.25 and then 14.50 on the way to 14 and 13.70
Bonus Idea: Saks, Ticker: SKS
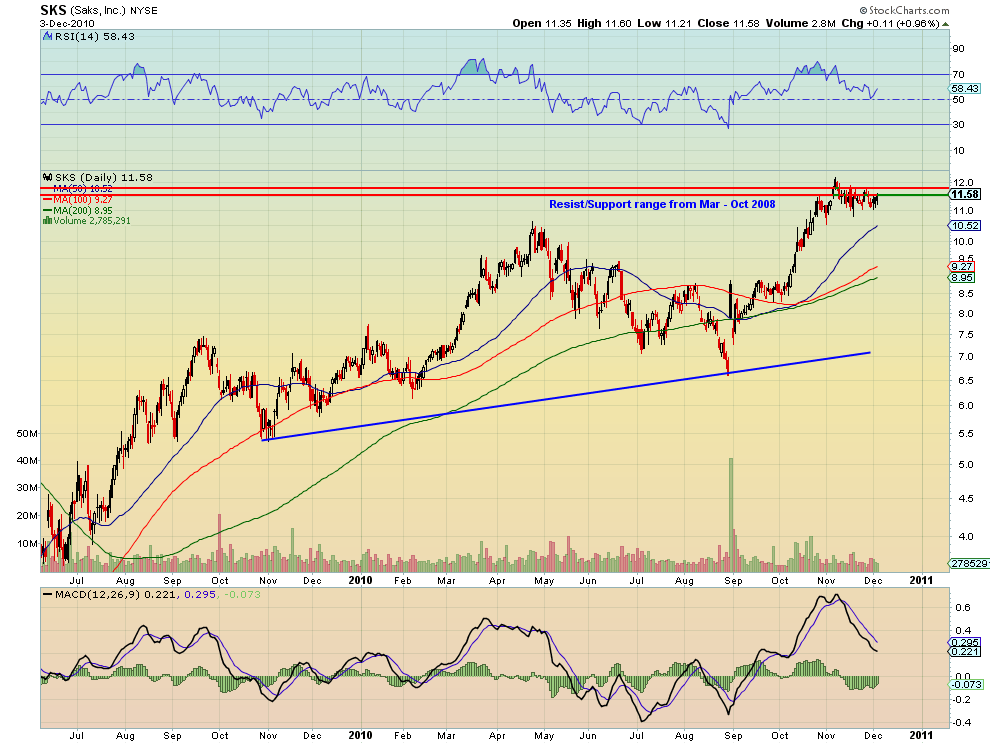
Saks is flagging at the resistance/support range from March through September of 2008. Seven months makes it very significant. If it can get over 11.85 then my target is 14.85. The RSI recently bottomed and is moving higher off of 50 and the MACD is now improving.
Trade’m well!
If you like what you see above sign up for deeper analysis and trading strategy by using the Get Premium button above. As always you can see details of individual charts and more on my StockTwits page.
The information in this blog post represents my own opinions and does not contain a recommendation for any particular security or investment. I or my affiliates may hold positions or other interests in securities mentioned in the Blog, please see my Disclaimer page for my full disclaimer.
blog comments powered by Disqus
-
 Gregory W. Harmon CMT, CFA, has traded since 1986 and held senior positions including Head of Global Trading, Head of Product Development, Head of Strategy and Director of Equity. (More)
 -
Subscribe to Dragonfly Capital Views
Lifetime Subscription
$4,000.00Sign upAnnual Subscription
$1,000.00Sign upQuarterly Subscription
$350.00Sign up
Recent Posts
- Bull Scan for 10-14-26
- Premium Earnings 10-13-26: Fastenal and Morgan Stanley
- Bull Scan for 10-13-26
- Premium Earnings 10-12-26: Citigroup and Johnson & Johnson
- 4 Trade Ideas Wells Fargo: Bonus Idea
- 5 Trade Ideas for Monday: AbbVie, Airbnb, Affirm, GE Aerospace and Walmart
- Top Trade Ideas for the Week of October 12, 2026: The Rest Premium
- Top Trade Ideas for the Week of October 12, 2026: The Best
- SPY Trends and Influencers October 10, 2026
- Macro Week in Review/Preview October 9, 2026
Archives