Today’s Massacre Call: Crude Oil will Drop 20%
- Posted by Greg Harmon
- on April 12th, 2011
The plunge in Crude Oil was the story for the day following on Silver’s hysteria yesterday (link below). I understand that a large brokerage house (that trades against you and me) called for a 20% correction. There were also talking heads all over the cable shows spouting about the large ‘global unrest’ premium in the fuel that should be unwound. Is the world safe again? Last week high oil prices were going to choke the economy and force stock prices lower. Now that it is selling off the weakness in crude is being linked to demand destruction forcing stocks lower. Confusing? This is why I watch television with the sound off and do not read the newspaper. There is a lot of noise out there. Let’s cut through that noise and see what story price history is telling.
West Texas Intermediate Crude, Monthly

There is a lot to look at in the monthly chart for West Texas Intermediate Crude Oil and it is hard to find something weak to point out. The Andrew’s Pitchfork shows price being drawn higher to the Median Line. The Relative Strength Index (RSI) is sloping higher as it just touches the technically overbought level. The Moving Average Convergence Divergence (MACD) is steadily increasing. The Simple Moving Averages (SMA) are all sloping higher, and the trend remains up. The one crack in the story is that the price is now above the top of the expanding Bollinger bands. This would suggest a consolidation or pullback to get within the top band at 105.01. On a pullback there is support at the 104.80 Fibonacci level and then 100 followed by the 95.36 Fibonacci level. Very bullish, but what about the weekly chart.
West Texas Intermediate Crude, Weekly
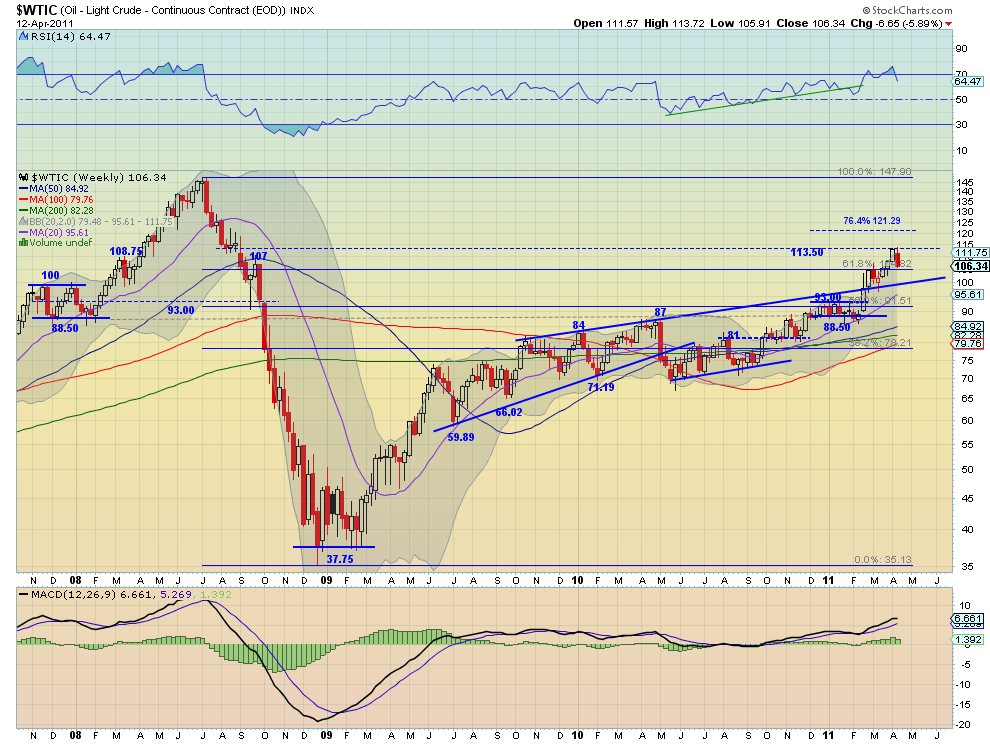
The weekly chart also looks very bullish for Crude Oil. On this timeframe it is riding the expanding Bollinger bands higher and has pulled back inside after peaking above it last week. The MACD is positive, but may be settling, and the RSI is firmly in bullish territory after having pulled back below the technically overbought level. All of the SMA’s are moving higher. The price found resistance at the 113.50 previous support level and has pulled back. There is support at 104.82 below. This timeframe is bullish but shows signs that a consolidation may occur between 104.82 and 113.50.
West Texas Intermediate Crude, Daily

The daily chart is where there are the most signs of weakness. But in general the chart on this timeframe is pulling back in an uptrend. The SMA’s are all sloping higher, the RSI is in the bullish territory but steeply sloped lower, and the MACD is turning negative. It fell from the top of the Bollinger bands Tuesday when it pulled back to the 20 day SMA, but is sitting above the mid line. There is still some room down to the 104.82 support and and it if breaks that there is support at 102 and then 100. Underneath that we can start to talk about a change in trend.
There may very well be a 20% correction to come in Crude Oil, but the charts do not show it today. A pullback, yes with potentially more downside but hold off on the dramatic for now. Trade what you see from the price history and avoid the noise.
Silver has Topped – I Bet You $1 Million
As always you can see details of individual charts and more on my StockTwits feed and on chartly.)
If you like what you see above sign up for deeper analysis and trading strategy by using the Get Premium button above. As always you can see details of individual charts and more on my StockTwits page.
The information in this blog post represents my own opinions and does not contain a recommendation for any particular security or investment. I or my affiliates may hold positions or other interests in securities mentioned in the Blog, please see my Disclaimer page for my full disclaimer.
blog comments powered by Disqus
-
 Gregory W. Harmon CMT, CFA, has traded since 1986 and held senior positions including Head of Global Trading, Head of Product Development, Head of Strategy and Director of Equity. (More)
 -
Subscribe to Dragonfly Capital Views
Lifetime Subscription
$4,000.00Sign upAnnual Subscription
$1,000.00Sign upQuarterly Subscription
$350.00Sign up
Recent Posts
- Bull Scan for 10-13-26
- Premium Earnings 10-12-26: Citigroup and Johnson & Johnson
- 4 Trade Ideas Wells Fargo: Bonus Idea
- 5 Trade Ideas for Monday: AbbVie, Airbnb, Affirm, GE Aerospace and Walmart
- Top Trade Ideas for the Week of October 12, 2026: The Rest Premium
- Top Trade Ideas for the Week of October 12, 2026: The Best
- SPY Trends and Influencers October 10, 2026
- Macro Week in Review/Preview October 9, 2026
- Bull Scan for 10-12-26
- How this Week’s Premium Top 10 Performed, October 9, 2026
Archives