To Study a Crocodile Look Beneath the Surface
- Posted by Greg Harmon
- on March 7th, 2011
Mentioning Crocs raises passionate debate among those that love the comfort and style of the plastic footwear to those that cannot believe anybody would pay money to wear recycled plastic bags and tires on their feet. Whichever side you are on you have to admit one thing: the phenomenon is not going away. But what about the fate of the stock. Remember it had been flying in the 70’s and then quickly crashed down to under a dollar per share. Since that fall it has been slowly moving higher like a Crocodile surveying the scene. At least that is what it seems from the safety of dry land looking at the surface.

Above is a daily chart of of Crocs, ticker CROX. Notice that over the past year and a half that it has been slowly but steadily moving higher. There was a lot of give and take when it hit the range between 9 and 11.30, but for the most part it has had a bullish Relative Strength Index (RSI) and rising Simple Moving Averages (SMA’s). The last four months appear to be grinding out a range between 15.49 and 18.30, with the possibility of breaking that range higher as the rising channel intersects the resistance level. The RSI is bullish and the Moving Average Convergence Divergence (MACD) indicator is improving and crossing higher, bullishly. It looks ready to break this range with resistance then at 19.54 the previous high, before it can move higher.
But what is happening with this beast underneath the surface? Look at the weekly chart for CROX below. After it drove the price lower for the better part of a year the 20 week SMA has now been lifting it higher for the last 18 months. In fact all of the weekly SMA’s except the 200 week SMA are moving and sloping higher. And the 20 week SMA has just crossed bullishly over the 200 week SMA. Notice also that the RSI has been bullish, without a day spent under the mid line, since the start of the rise. Flipping to the Fibonacci levels it is just getting tangled with the 23.6% retracement level at 18.35 now.
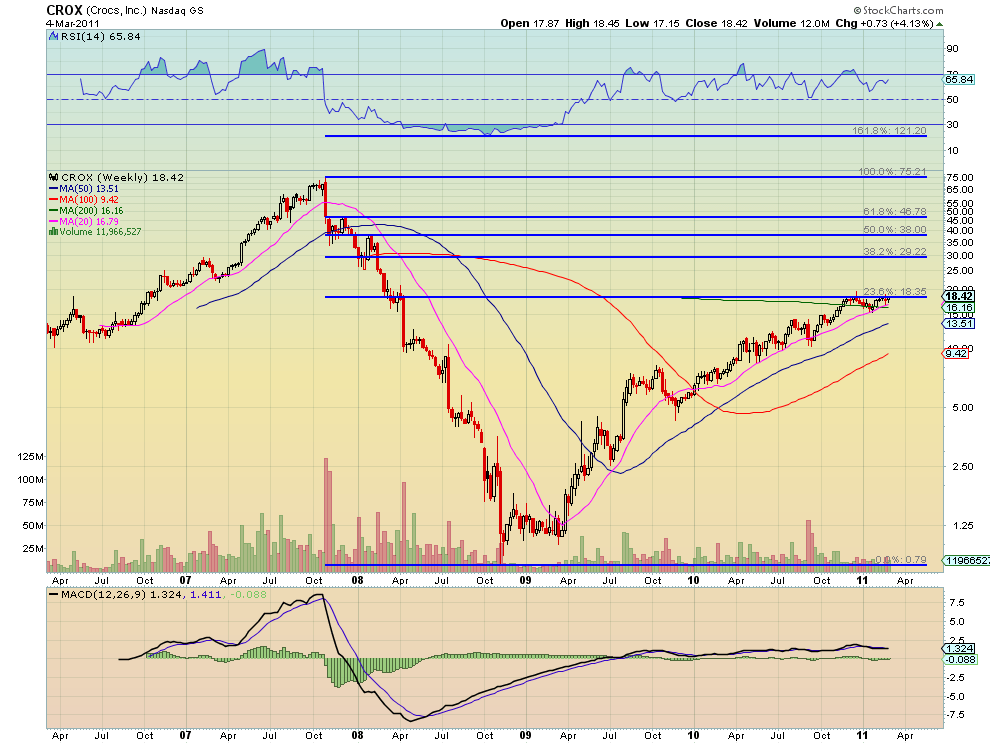
Translation: if it can clear this Fibonacci level, by holding over 19 then the rally in CROX is just getting started. And remember from the daily chart that it looks to be primed to start that move now. The next target would be the 38.2% Fibonacci retracement level at 29.22, and most technical analysis would then look for a 50% retracement to 39.00 or the 61.8% level at 46.76. And you thought the slow grind from a dollar to 18.30 was a triumph.
(As always you can see details of individual charts and more on my StockTwits feed and on chartly.)
If you like what you see above sign up for deeper analysis and trading strategy by using the Get Premium button above. As always you can see details of individual charts and more on my StockTwits page.
The information in this blog post represents my own opinions and does not contain a recommendation for any particular security or investment. I or my affiliates may hold positions or other interests in securities mentioned in the Blog, please see my Disclaimer page for my full disclaimer.
blog comments powered by Disqus
-
 Gregory W. Harmon CMT, CFA, has traded since 1986 and held senior positions including Head of Global Trading, Head of Product Development, Head of Strategy and Director of Equity. (More)
 -
Subscribe to Dragonfly Capital Views
Lifetime Subscription
$4,000.00Sign upAnnual Subscription
$1,000.00Sign upQuarterly Subscription
$350.00Sign up
Recent Posts
- Bull Scan for 10-13-26
- Premium Earnings 10-12-26: Citigroup and Johnson & Johnson
- 4 Trade Ideas Wells Fargo: Bonus Idea
- 5 Trade Ideas for Monday: AbbVie, Airbnb, Affirm, GE Aerospace and Walmart
- Top Trade Ideas for the Week of October 12, 2026: The Rest Premium
- Top Trade Ideas for the Week of October 12, 2026: The Best
- SPY Trends and Influencers October 10, 2026
- Macro Week in Review/Preview October 9, 2026
- Bull Scan for 10-12-26
- How this Week’s Premium Top 10 Performed, October 9, 2026
Archives