Timing is Everything with Artichokes and Stocks
- Posted by Greg Harmon
- on May 3rd, 2011
Organic, natural and local foods have been the rage for some time. But with that there can be some risk of spoiled produce or the good meat and fish already being sold out. You need to know that produce arrives at noon and fish right when they open to be able to time it right. From the look of the charts of two of the stars in this field, Whole Foods Markets (ticker: $WFMI) and Hain Celestial Group (ticker: $HAIN) they the timing has been right to own their stocks. But with Hain reporting earnings Tuesday with a beat and raise, and then unable to make new highs in after hours trading, and Whole Foods (reports after the bell Wednesday) pulling back over the last few days are these stocks about to spoil? Let’s look at the technicals.
Hain Celestial Group, HAIN
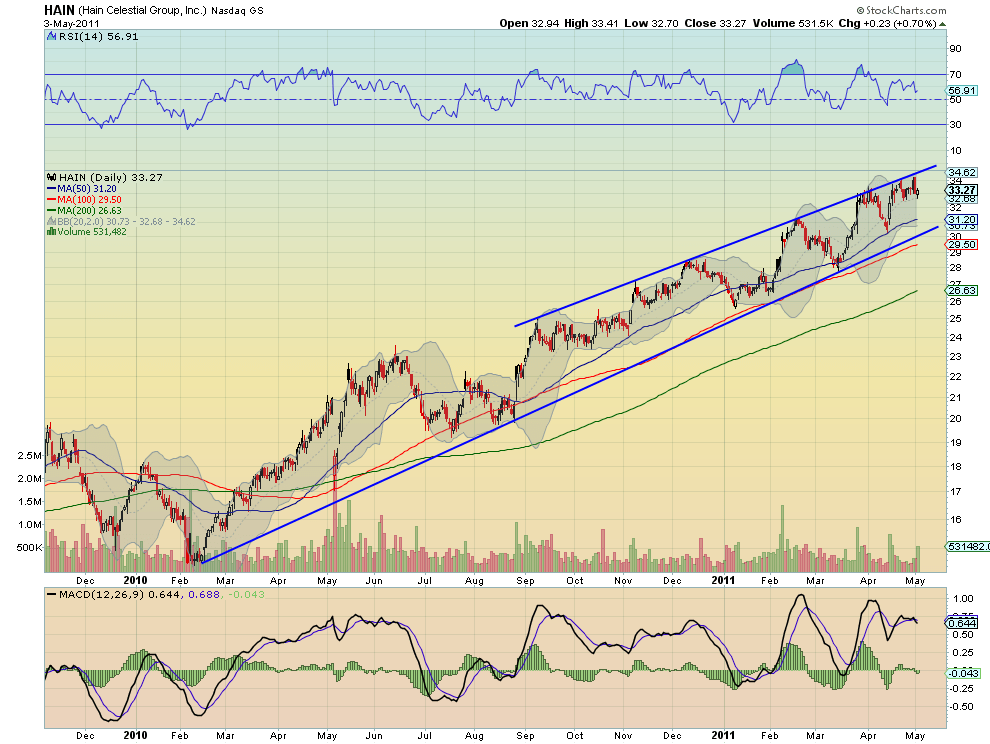
Hain has been riding rising trendline support, roughly parallel to the 100 day Simple Moving Average (SMA), since February 2010. In September it discovered trendline resistance as well creating a parallel channel. With earnings behind it, as noted above, it looks to have resistance slightly above the 34.10 it is trading after hours, at 34.62. But the Relative Strength Index (RSI) is ratcheting down and the Moving Average Convergence Divergence (MACD) indicator is crossing negative again. The upside looks limited unless it can get through the channel where you could then expect a $4 run higher equivalent to the channel width. The reward to risk ratio on a long trade is not there until it breaks the channel. Instead look to play it on the short side either with a hold at the channel top or a break the mid line of the Bollinger bands, currently at 32.68 and march it down to the 50 day SMA at 31.20, or the channel bottom at 30.70 below.
Whole Foods Markets, WFMI

The chart for Whole Foods looks worse but may be at a turning point. After riding a complex channel higher from a gap up in November, WFMI created a double top at 66.77 and has pulled back to the 23.6% Fibonacci retracement of the full move higher, at 59.02, started in October. Support? If not there is more support lower at 56.60. The RSI is starting to hook and the volume has been decreasing on the move lower, with it printing a Hammer candle, a potential reversal, Tuesday closing outside of the lower Bollinger band. Before you load up the shopping cart WFMI, remember they report after the bell Wednesday. Their last two reports have led to big gaps higher. This is good news as it has led to Implied Volatility on the options to move up to 48.2%, well above the historical volatility at 25.24%. Still, the May Expiry options anticipate a $6 move by expiry (less the time value). But look at the size of the recent earnings moves. That could happen in one day. On a hold of 59.02 this is a good trade to buy long, but as an earnings trade look at the also selling the May 60 Straddle for $6.00. If you still like the stock after earnings you can buy back the straddle (or one leg) with lower volatility and thus a lower price, reducing your basis.
As always you can see details of individual charts and more on my StockTwits feed and on chartly.)
If you like what you see above sign up for deeper analysis and trading strategy by using the Get Premium button above. As always you can see details of individual charts and more on my StockTwits page.
The information in this blog post represents my own opinions and does not contain a recommendation for any particular security or investment. I or my affiliates may hold positions or other interests in securities mentioned in the Blog, please see my Disclaimer page for my full disclaimer.
blog comments powered by Disqus
-
 Gregory W. Harmon CMT, CFA, has traded since 1986 and held senior positions including Head of Global Trading, Head of Product Development, Head of Strategy and Director of Equity. (More)
 -
Subscribe to Dragonfly Capital Views
Lifetime Subscription
$4,000.00Sign upAnnual Subscription
$1,000.00Sign upQuarterly Subscription
$350.00Sign up
Recent Posts
- Premium Earnings 10-12-26: Citigroup and Johnson & Johnson
- 4 Trade Ideas Wells Fargo: Bonus Idea
- 5 Trade Ideas for Monday: AbbVie, Airbnb, Affirm, GE Aerospace and Walmart
- Top Trade Ideas for the Week of October 12, 2026: The Rest Premium
- Top Trade Ideas for the Week of October 12, 2026: The Best
- SPY Trends and Influencers October 10, 2026
- Macro Week in Review/Preview October 9, 2026
- Bull Scan for 10-12-26
- How this Week’s Premium Top 10 Performed, October 9, 2026
- Bull Scan for 10-9-26
Archives