Time to Stomp the Little Guy, What We do Best, Go America!
- Posted by Greg Harmon
- on April 12th, 2011
Emerging Markets have been on fire while the US markets have been pulling back. But there are signs that trend may be reversing. Ready for a quick trade to take advantage of it? Below is the ratio chart for the S&P 500 ETF,$SPY, vs the Emerging Markets ETF,$EEM. This pair has been in a downward channel since the end of February. Recently it has bounced off of the channel bottom and back over the 200 day Simple Moving Average (SMA). It tested that level again Monday and held. Additionally the Relative Strength Index (RSI) has based and is now moving higher and the Moving Average Convergence Divergence (MACD) indicator peaked negative and is now improving. As long as this continues a reversal may be happening.
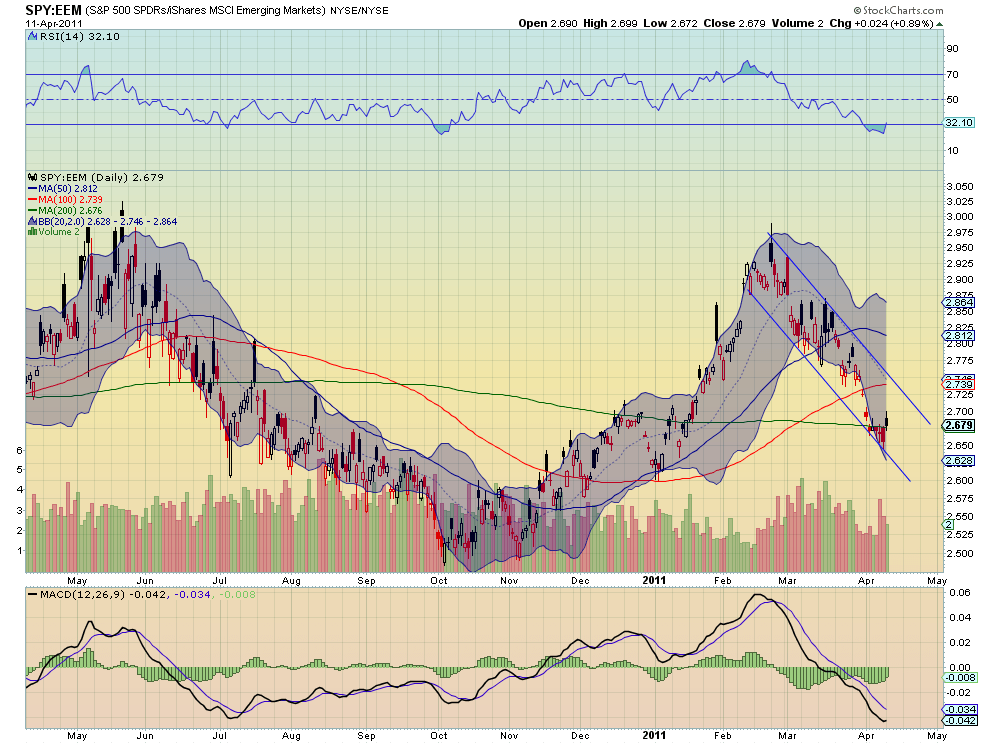
Using the 200 day SMA as a stop, this can be played by buying 100 shares of SPY for every 268 shares sold short of EEM (a shape). Look for a move to a ratio of 2.74 which would mean a profit of $295 – $302 for each shape traded. This will bring it to the top of the channel. If it can get through that then the next target would be the 50 day SMA at 2.81 for a profit of $618-$648 per shape. Trade’m well.
As always you can see details of individual charts and more on my StockTwits feed and on chartly.)
If you like what you see above sign up for deeper analysis and trading strategy by using the Get Premium button above. As always you can see details of individual charts and more on my StockTwits page.
The information in this blog post represents my own opinions and does not contain a recommendation for any particular security or investment. I or my affiliates may hold positions or other interests in securities mentioned in the Blog, please see my Disclaimer page for my full disclaimer.
blog comments powered by Disqus
-
 Gregory W. Harmon CMT, CFA, has traded since 1986 and held senior positions including Head of Global Trading, Head of Product Development, Head of Strategy and Director of Equity. (More)
 -
Subscribe to Dragonfly Capital Views
Lifetime Subscription
$4,000.00Sign upAnnual Subscription
$1,000.00Sign upQuarterly Subscription
$350.00Sign up
Recent Posts
- Bull Scan for 10-13-26
- Premium Earnings 10-12-26: Citigroup and Johnson & Johnson
- 4 Trade Ideas Wells Fargo: Bonus Idea
- 5 Trade Ideas for Monday: AbbVie, Airbnb, Affirm, GE Aerospace and Walmart
- Top Trade Ideas for the Week of October 12, 2026: The Rest Premium
- Top Trade Ideas for the Week of October 12, 2026: The Best
- SPY Trends and Influencers October 10, 2026
- Macro Week in Review/Preview October 9, 2026
- Bull Scan for 10-12-26
- How this Week’s Premium Top 10 Performed, October 9, 2026
Archives