Time to ‘Just Buy the Dip’ in Silver – Not So Fast
- Posted by Greg Harmon
- on January 20th, 2011

Silver is down more than 10% from its high at the end of the year and the daily, End of Day (EOD), chart (above) shows the metal near support in an uptrend close to the 23.6% Fibonacci level, near the bottom of the Bollinger bands and the highs reached twice in November. The pieces of Moving Average Convergence Divergence (MACD) indicator are nearing long term support and the indicator itself looks to be leveling and reversing. The relative Strength Index (RSI) has been trending down but recently bounced back towards the mid line, without having gone much below it. Is it time to ‘just buy the dip’? Not so fast.
The weekly chart below shows the last 7 years history of the number 2 metal.
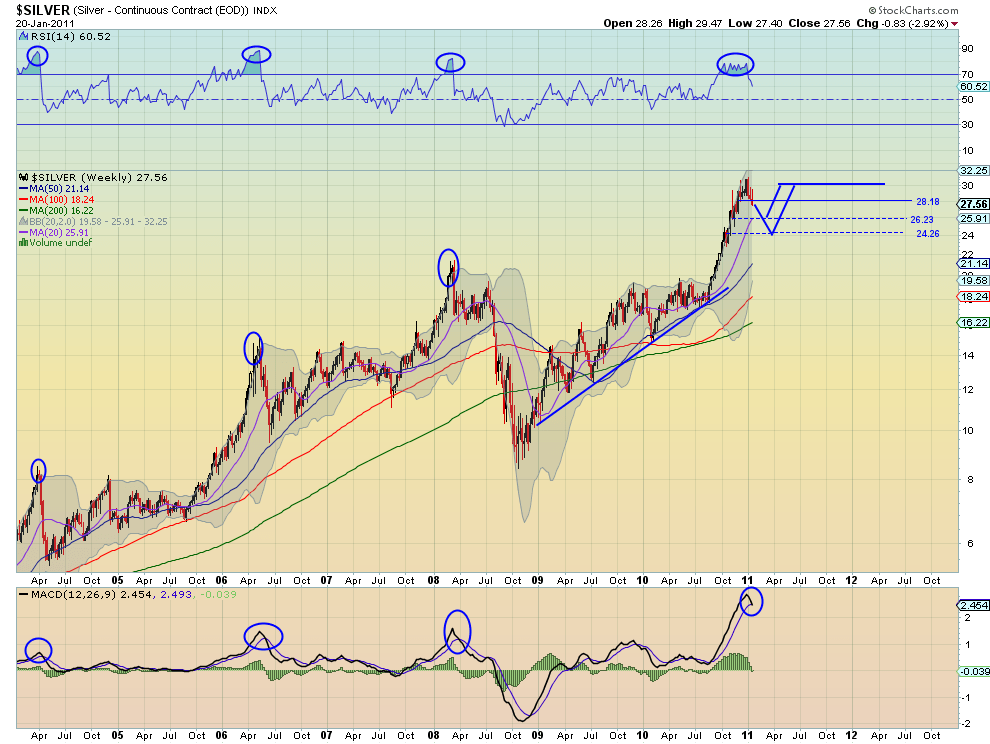
Note how technically and cyclically it has traded over this period. There is a pattern of rising to a peak, selling off steeply, recovering and then a long sideways consolidation which repeats. The first two cycles on the chart were nearly exactly two years in duration, with the period from the beginning of the fall to the return being about 7 months. The third cycle has been longer and deeper, probably due to the financial crisis occurring right in the middle of it. Note that the beginning of each downward cycle has coincided with an overbought condition on the RSI and a cross in the MACD, as highlighted in the blue circles.
If this pattern continues for another cycle, then Silver is quite possibly ready for a sizable further pullback. There are two areas of support noted on the chart at 26.23 and below that at 24.26. A continuation of the pattern would suggest that the bottom will happen near one of these levels. That could be another 10% or more lower, before a bounce back towards 30 and then the sideways consolidation. Notice that those levels are just barely below the 100 day Simple Moving Average (SMA) from the top chart. Very realistic. If that pattern plays out to its end, then the eventual rise may not happen until mid 2012. So buying the dip now would only make sense if your investment horizon is longer than 2 years. Otherwise wait for the real dip to happen. A final note, all of these prices and charts refer to Silver the commodity but apply equally to the Silver ETF, iShares Silver Trust, (Ticker: SLV) equally as well.
Trade’m well.
(As always you can see details of individual charts and more on my StockTwits feed and on chartly.)
If you like what you see above sign up for deeper analysis and trading strategy by using the Get Premium button above. As always you can see details of individual charts and more on my StockTwits page.
The information in this blog post represents my own opinions and does not contain a recommendation for any particular security or investment. I or my affiliates may hold positions or other interests in securities mentioned in the Blog, please see my Disclaimer page for my full disclaimer.
blog comments powered by Disqus
-
 Gregory W. Harmon CMT, CFA, has traded since 1986 and held senior positions including Head of Global Trading, Head of Product Development, Head of Strategy and Director of Equity. (More)
 -
Subscribe to Dragonfly Capital Views
Lifetime Subscription
$4,000.00Sign upAnnual Subscription
$1,000.00Sign upQuarterly Subscription
$350.00Sign up
Recent Posts
- Premium Earnings 10-13-26: Fastenal and Morgan Stanley
- Bull Scan for 10-13-26
- Premium Earnings 10-12-26: Citigroup and Johnson & Johnson
- 4 Trade Ideas Wells Fargo: Bonus Idea
- 5 Trade Ideas for Monday: AbbVie, Airbnb, Affirm, GE Aerospace and Walmart
- Top Trade Ideas for the Week of October 12, 2026: The Rest Premium
- Top Trade Ideas for the Week of October 12, 2026: The Best
- SPY Trends and Influencers October 10, 2026
- Macro Week in Review/Preview October 9, 2026
- Bull Scan for 10-12-26
Archives