The SPY Bottom Will Be At ….Now What?
- Posted by Greg Harmon
- on March 16th, 2011
Everybody and their mother has a prediction as to how far the market will fall. Overheard at the bar today: “10% is the limit.” “No it will be a two standard deviation move from the 50 day moving average.” “That’s not right it will stop at the next Fibonacci level.” “Hogwash, when the S&P 500 falls outside of the Bollinger bands it will stop.” It makes good conversation but nobody knows where the slide will end. NOBODY! We can all use our tools and calculators but the exact bottom is elusive. What we can do is determine where our bias would shift into a strong enough position to be either long or short. While you are sitting on the sidelines twiddling your thumbs I have determined my boundaries and am ready for tomorrow to reap the rewards of my deep thought. Allow me to share them with you and perhaps stimulate your brain one last time before March Madness begins.
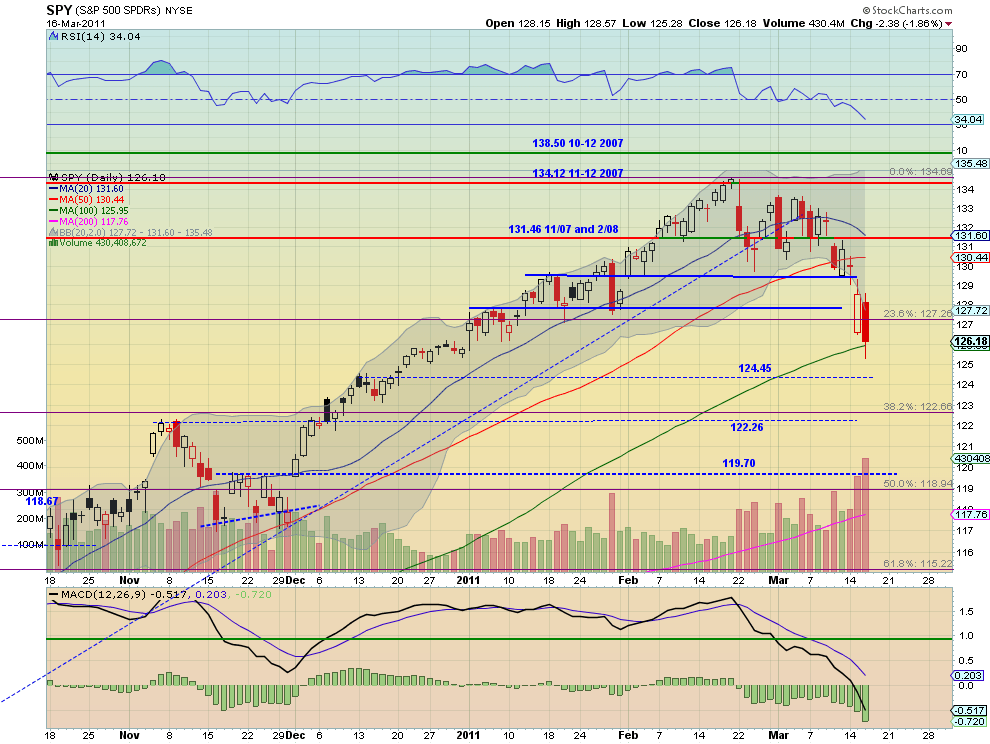
Above is a chart of the S&P 500 ETF,$SPY. Definitely a downtrend. But today it closed 1.2% outside of the Bollinger bands and just above the 100 day Simple Moving Average (SMA). Those would be some good places for the SPY to stop falling but notice that the volume is increasing as it falls. That tells me more downside to come. This market now looks to have a potential to move to 120-122 based on the support levels near 122.26 – 122.66 and then 119.70. That would be approximately a 10% move down from the top as well. Below that I would have to reassess. Also above 131.42 again and many would get back in long for the next leg higher. Certainly above 133 at least. So these are my boundaries 122 and 131. To keep this decision making short term look at the March 31 options board below.
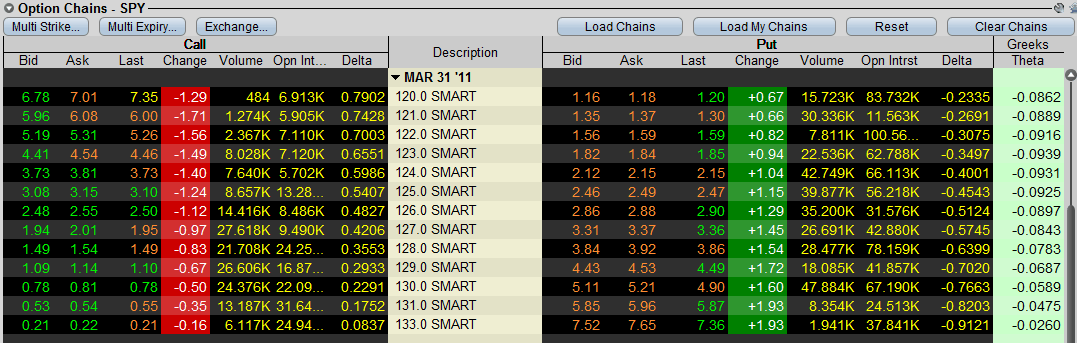
This snapshot was taken just after 4:00 pm on Wednesday. The play to make based on my boundaries above is to sell Strangles using the 122 put and the 131 call. Selling one each of these options brings in a premium of $2.09 based on the bid prices listed. If the SPY falls below 122 on March 31 then I will own it with a basis of 119.91 and if it closes above 131, I will be short it with a basis of 133.09. A close anywhere in between and I get to pocket the premium. And frankly I do not like the market until it gets out of that range anyway. As it breaks 131 go long as a hedge of the short option, but hey you like the market up here anyway right, go so long twice.
If you cannot sell naked options then you could trade a variant of this idea by additionally buying the 120 puts and 133 calls turning it into an Iron Condor. The total cost is $1.40, against the $2.09 netting you $0.69, against a maximum loss of $1.31 if the SPY closes right at 133 or 120. These levels may not be the right ones for you, but if they are not then what are yours? Be prepared.
As always you can see details of individual charts and more on my StockTwits feed and on chartly.)
If you like what you see above sign up for deeper analysis and trading strategy by using the Get Premium button above. As always you can see details of individual charts and more on my StockTwits page.
The information in this blog post represents my own opinions and does not contain a recommendation for any particular security or investment. I or my affiliates may hold positions or other interests in securities mentioned in the Blog, please see my Disclaimer page for my full disclaimer.
blog comments powered by Disqus
-
 Gregory W. Harmon CMT, CFA, has traded since 1986 and held senior positions including Head of Global Trading, Head of Product Development, Head of Strategy and Director of Equity. (More)
 -
Subscribe to Dragonfly Capital Views
Lifetime Subscription
$4,000.00Sign upAnnual Subscription
$1,000.00Sign upQuarterly Subscription
$350.00Sign up
Recent Posts
- Bull Scan for 10-13-26
- Premium Earnings 10-12-26: Citigroup and Johnson & Johnson
- 4 Trade Ideas Wells Fargo: Bonus Idea
- 5 Trade Ideas for Monday: AbbVie, Airbnb, Affirm, GE Aerospace and Walmart
- Top Trade Ideas for the Week of October 12, 2026: The Rest Premium
- Top Trade Ideas for the Week of October 12, 2026: The Best
- SPY Trends and Influencers October 10, 2026
- Macro Week in Review/Preview October 9, 2026
- Bull Scan for 10-12-26
- How this Week’s Premium Top 10 Performed, October 9, 2026
Archives