The Most Boring Sector Review Ever: Cha-Ching!
- Posted by Greg Harmon
- on February 19th, 2011
“This sector is in an uptrend with all the Simple Moving Averages (SMA’s) sloping higher. The Relative Strength Index (RSI) is in the technically overbought condition but not anywhere near an extreme level. The Moving Average Convergence Divergence (MACD) indicator is slightly positive and the price has been rising near the top of the Bollinger bands. Look for this trend to continue going forward.”
This paragraph can be used for the analysis of six of the nine SPDR Sector charts. Wow I feel like the IBM computer, Watson, everything is a winner. That is a measure of just how broad based the advance in the market is. Those sectors are Energy Select Sector SPDR, XLE, Financials Select Sector SPDR, XLF, Industrials Select Sector SPDR, XLI, Technology Select Sector SPDR, XLK, Health Care Select Sector SPDR, XLV and Consumer Discretionary Select Sector SPDR, XLY. This is great news for trend followers and investors but makes for an uninteresting market for traders and leaves little to write about. Let’s look beyond these sectors and into those few that do show some interesting aspects.
Materials Select Sector SPDR, XLB
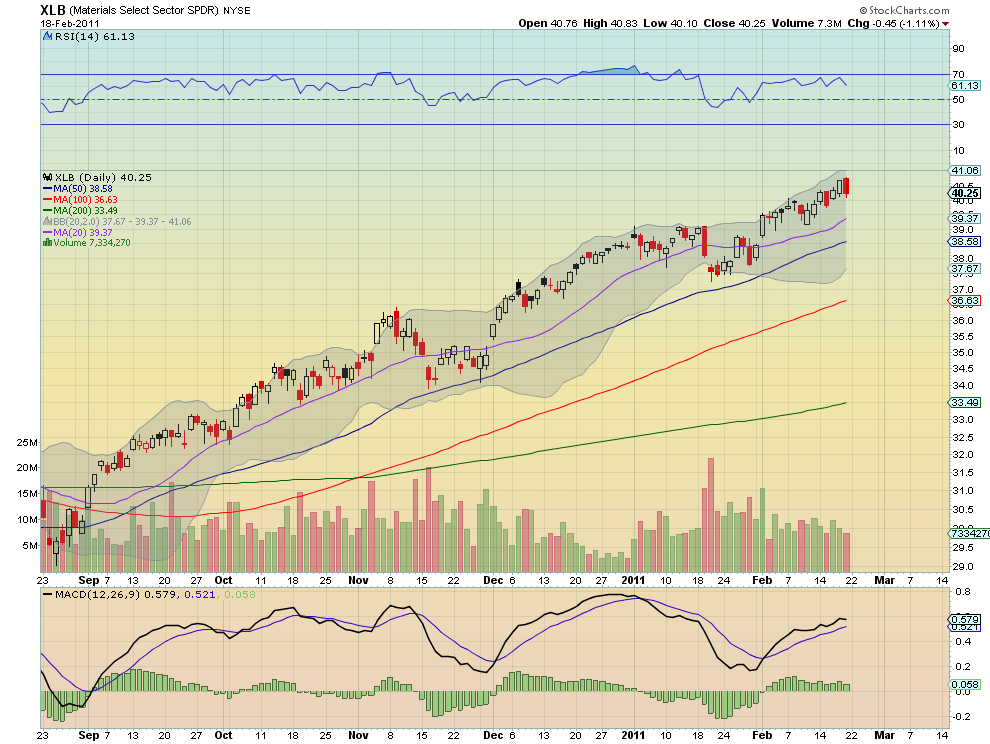
Materials Select Sector SPDR, XLB is the closest to the other 6 sectors and the paragraph above could be used with only a minor modification. The RSI has not yet reached the overbought condition. But there are a couple of interesting things to note on this chart. In addition to not reaching the 70 overbought level the RSI has bounced before reaching it several times recently. It also printed a bearish engulfing candle, which if confirmed could signal a reversal lower. Don’t get too excited for a reversal though, as this has happened previously just 4 days prior, but it is something out of the normal to watch in this broad based rally.
Consumer Staples Select Sector SPDR, XLP

Consumer Staples Select Sector SPDR, XLP is interesting because it has been in a consolidation range between 28.75 and 29.75 since mid December. But Friday it broke this range to a new high. As it did that the RSI is rising and the MACD is increasing. Also the Bollinger bands are expanding allowing for further upside. This may be the start of the re-addition of XLP to the party in the market.
Utilities Select Sector SPDR, XLU
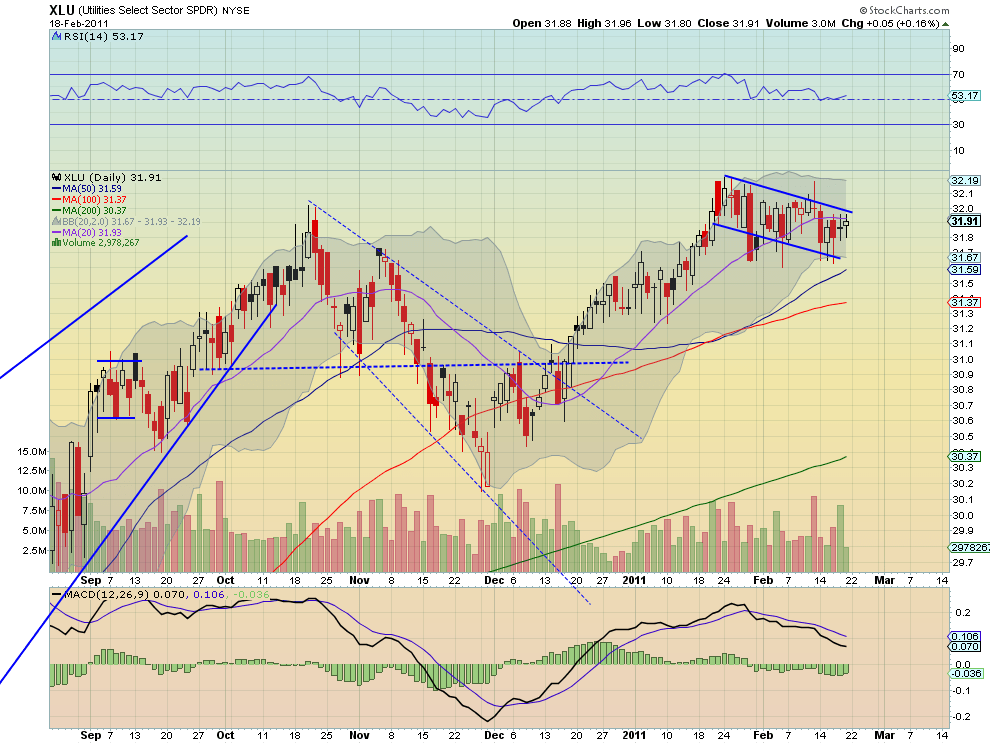
That leaves just the Utilities Select Sector SPDR, XLU. XLU moved higher from the beginning of December but stalled as it moved into late January. It has been in a bull flag since then which is getting a little long in the tooth. But there are signs that may be changing as the RSI has bounced off of the mid line and is starting to head higher and the MACD is starting to improve. If it can get through the 20 day SMA and above the top of the flag it should pull the 20 day SMA higher. All the SMA’s will be sloping up then. Again don’t get too excited though as it has shown difficulty in getting through the 20 day SMA since falling under it a week ago.
So don’t say I did not warn you, this market is getting boring. Of course that is the best time to stay alert and prepared for a change. Use this analysis as you prepare for the week ahead and trade’m well.
As always you can see details of individual charts and more on my StockTwits feed and on chartly.)
If you like what you see above sign up for deeper analysis and trading strategy by using the Get Premium button above. As always you can see details of individual charts and more on my StockTwits page.
The information in this blog post represents my own opinions and does not contain a recommendation for any particular security or investment. I or my affiliates may hold positions or other interests in securities mentioned in the Blog, please see my Disclaimer page for my full disclaimer.
blog comments powered by Disqus
-
 Gregory W. Harmon CMT, CFA, has traded since 1986 and held senior positions including Head of Global Trading, Head of Product Development, Head of Strategy and Director of Equity. (More)
 -
Subscribe to Dragonfly Capital Views
Lifetime Subscription
$4,000.00Sign upAnnual Subscription
$1,000.00Sign upQuarterly Subscription
$350.00Sign up
Recent Posts
- Bull Scan for 10-13-26
- Premium Earnings 10-12-26: Citigroup and Johnson & Johnson
- 4 Trade Ideas Wells Fargo: Bonus Idea
- 5 Trade Ideas for Monday: AbbVie, Airbnb, Affirm, GE Aerospace and Walmart
- Top Trade Ideas for the Week of October 12, 2026: The Rest Premium
- Top Trade Ideas for the Week of October 12, 2026: The Best
- SPY Trends and Influencers October 10, 2026
- Macro Week in Review/Preview October 9, 2026
- Bull Scan for 10-12-26
- How this Week’s Premium Top 10 Performed, October 9, 2026
Archives