Stocks, Gold, Bonds all falling at the Same Time, Why?
- Posted by Greg Harmon
- on November 16th, 2010
I have heard this a lot lately. Shortly after the September FOMC meeting I wrote an article explaining the importance of the Fed’s desire for inflation in the policy statement, in an article titled History is Important: 2003 All Over Again? In that article I noted that with short term interest rates at zero the only tool for the Fed to create inflation would be to devalue the dollar, and this would lead to higher stock and commodity prices. Inflation is obviously bad for bonds, so US Treasury yields would also rise in that environment. Since then the scenario has played out until about 2 weeks ago. Here is a weekly chart of the iShares Barclays 20+ Year Treasury Bond Fund ETF, TLT.

A clear downtrend since that FOMC meeting September 21st. But now although US Treasuries prices are still falling (yields rising), Gold and stock prices are falling.
What changed? Look at the short term daily charts of the SPY and Gold below.
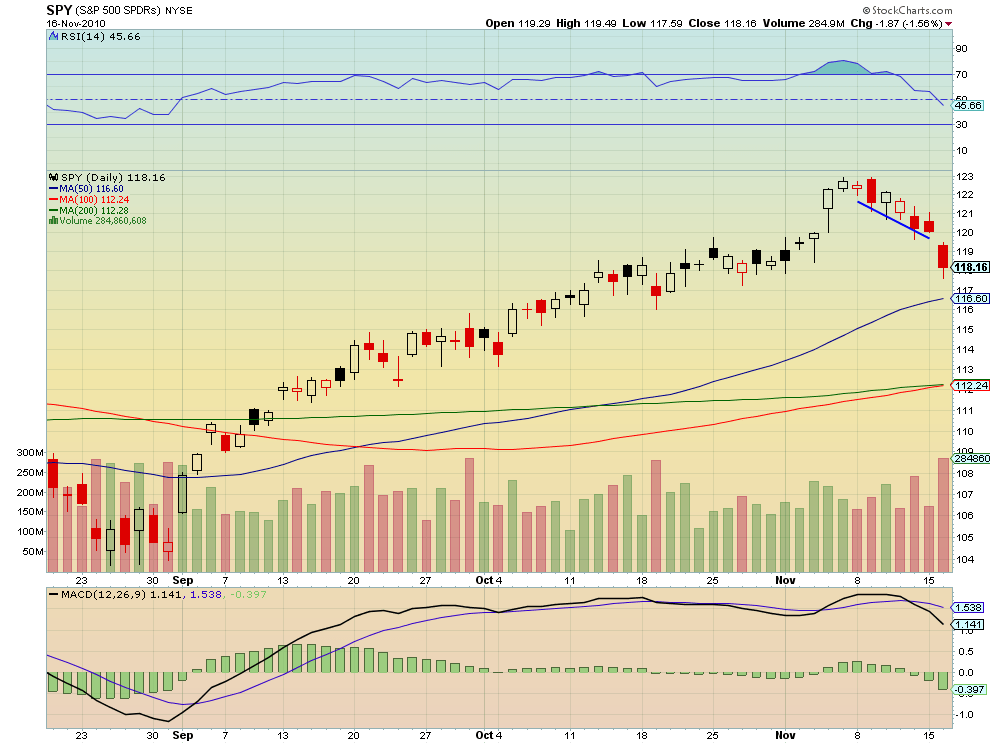

Both show a change in direction starting Friday November 5th. Inflation still is expected (or here) so bonds are still heading lower. But stocks and Gold are now heading lower also. Yeah there was probably some profit taking from the post election run up, and some concern about municipal debt in California (what about NY, NJ, Illinois?). California, maybe, it is big, but doubt the US will let it fail. Oh, there is talk about China slowing down, but frankly all statistics out of China are made up and they will keep chugging along. China may have a short term slow down but it will be reversed quickly, just because they can, so I discount that.
Dollar Driving
More interesting to me is that this is the point where questions started to emerge about the health of Ireland and Greece, and talk about the G20 conference. What do these have in common? They both impact the US Dollar. If there was an effort to make the dollar look stronger or at least stop the bleeding ahead of the G20 and that coincided with questions about the strength of the PIIG’s, this should, in the short run move the US dollar Index higher and the Euro lower. This is exactly what has happened. Look at the chart of the US Dollar Index and the Currency Shares Euro Trust ETF, FXE.
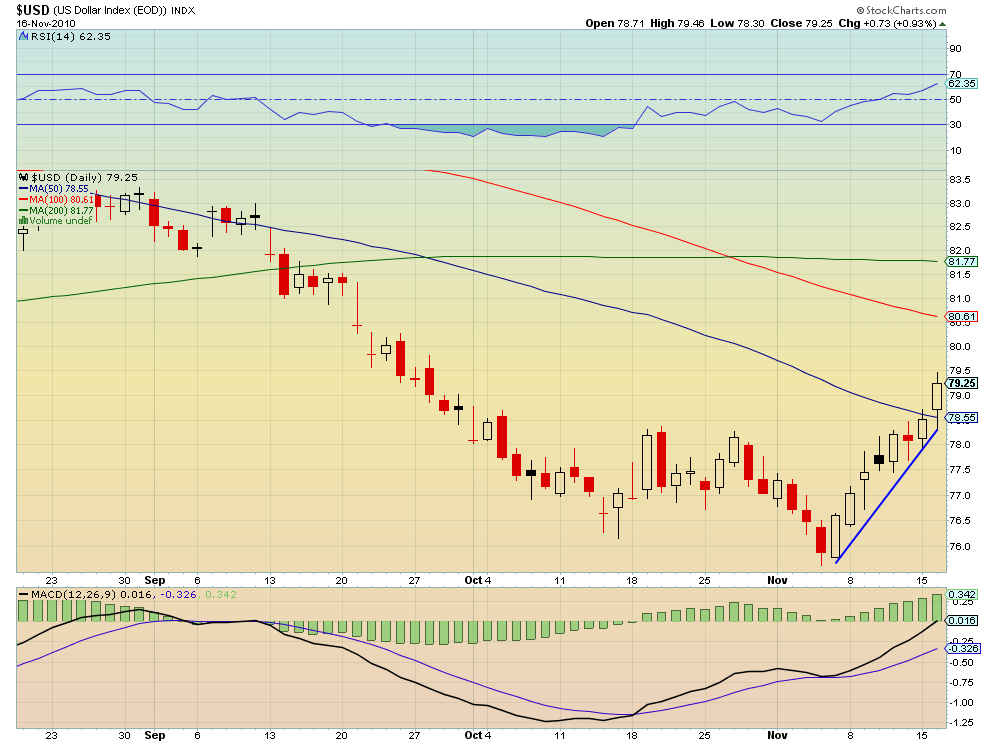
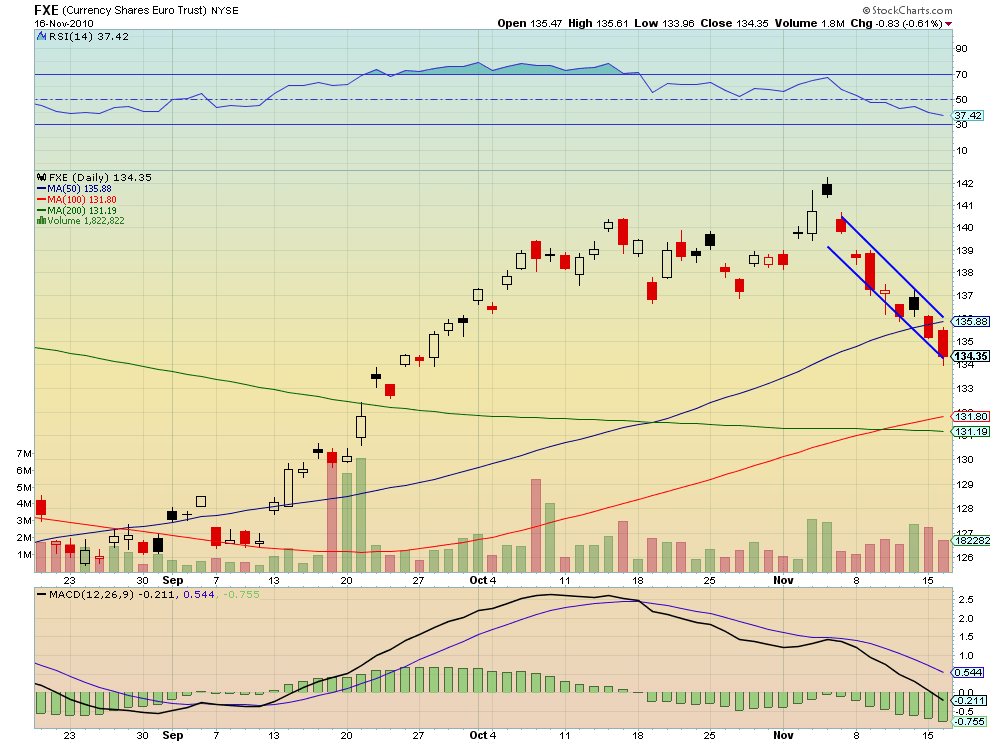
The US Dollar Index started moving higher precisely when it would be expected going into a G20 meeting and it is clear that it is at the expense of the Euro. It has been this Dollar move that has reversed the uptrends in Gold and stocks despite an environment that that is ripe for a further rise. The G20 is over now but the crisis in Ireland is gaining attention. Watch for a top and reversal, on the US Dollar Index perhaps very soon when the PIIG’s news is absorbed, to lead to a further rise in Gold and Stock prices. The weekly and monthly charts for the US Dollar Index (below) suggest the first spot this could happen is around 80, where the moving averages are crossing and close to where we are now. Other key resistance is noted on the weekly (81 and 82.08) and the monthly (85.45-86.3) charts. Trade well!
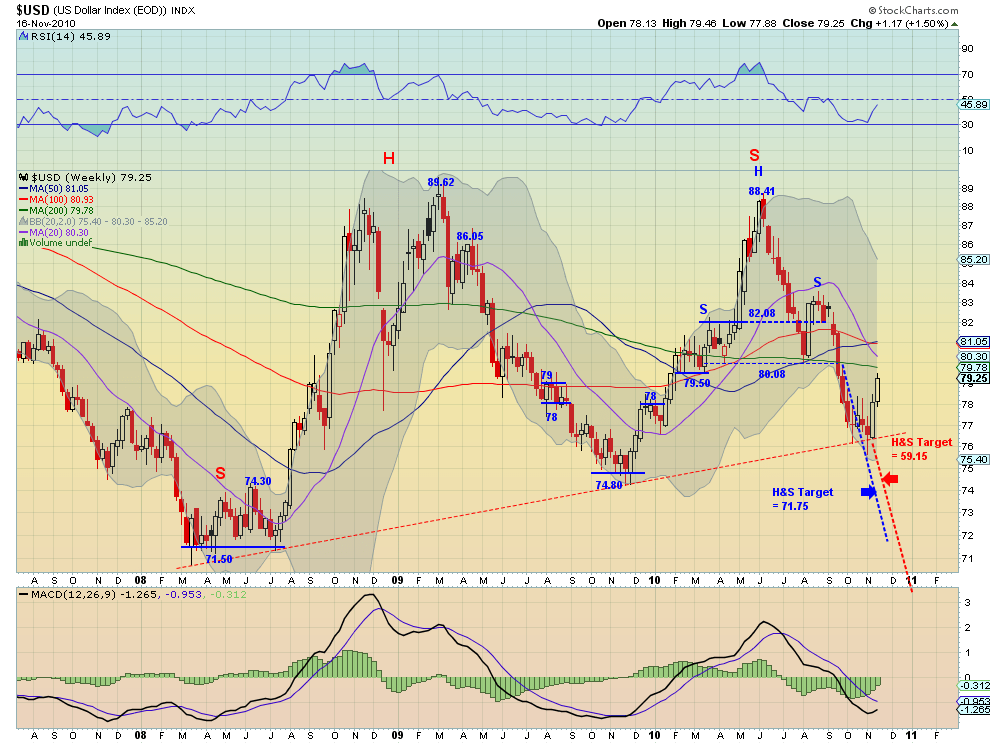

(As always you can see these individual charts and more on my twitter feed and on chartly.)
If you like what you see above sign up for deeper analysis and trading strategy by using the Get Premium button above. As always you can see details of individual charts and more on my StockTwits page.
The information in this blog post represents my own opinions and does not contain a recommendation for any particular security or investment. I or my affiliates may hold positions or other interests in securities mentioned in the Blog, please see my Disclaimer page for my full disclaimer.
blog comments powered by Disqus
-
 Gregory W. Harmon CMT, CFA, has traded since 1986 and held senior positions including Head of Global Trading, Head of Product Development, Head of Strategy and Director of Equity. (More)
 -
Subscribe to Dragonfly Capital Views
Lifetime Subscription
$4,000.00Sign upAnnual Subscription
$1,000.00Sign upQuarterly Subscription
$350.00Sign up
Recent Posts
- Bull Scan for 10-14-26
- Premium Earnings 10-13-26: Fastenal and Morgan Stanley
- Bull Scan for 10-13-26
- Premium Earnings 10-12-26: Citigroup and Johnson & Johnson
- 4 Trade Ideas Wells Fargo: Bonus Idea
- 5 Trade Ideas for Monday: AbbVie, Airbnb, Affirm, GE Aerospace and Walmart
- Top Trade Ideas for the Week of October 12, 2026: The Rest Premium
- Top Trade Ideas for the Week of October 12, 2026: The Best
- SPY Trends and Influencers October 10, 2026
- Macro Week in Review/Preview October 9, 2026
Archives