SPY Trends and Influencers October 8, 2011
- Posted by Greg Harmon
- on October 8th, 2011
Last week’s review of the macro market indicators looked into the first week of the 4th Quarter and saw it very similar to what it did the previous week. Gold ($GLD) and Crude Oil ($USO) were set up to continue lower with a chance that Gold consolidates instead. The US Dollar ($UUP) and Treasuries ($TLT) were set up to continue higher and the Shanghai Composite ($SSEC) and Emerging Markets ($EEM) lower. Volatility ($VIX) was expected to remain elevated and perhaps increase, supporting the negative bias in the Equity Index ETF’s $SPY, $IWM and $QQQ. At that point the QQQ which had been holding US Equities up looked the weakest. A key to the week may again be whether the strength in Treasuries and the US Dollar continue. If they do, more downside was nearly guaranteed for the Equity Index ETF’s. A total collapse by the Shanghai Composite instead of the orderly move to date could also trigger a US Equity collapse. The cards were getting stacked against the US Equity market.
The week began with Gold and Oil falling, but both recovered and moved higher, before Gold dropped again Friday. The US Dollar moved higher and then consolidated while Treasuries made new highs before pulling back. The Shanghai Composite did nothing because it was closed all week for holidays (DOH!) and Emerging Markets bounced off new lows before retreating to end the week. Volatility fell slightly but remained in its higher range. The Equity Index ETF’s made new lows before surging as much as 10%, ending the week higher. What does this mean for the coming week? Lets look at some charts.
As always you can see details of individual charts and more on my StockTwits feed and on chartly.)
SPY Daily, $SPY

SPY Weekly, $SPY
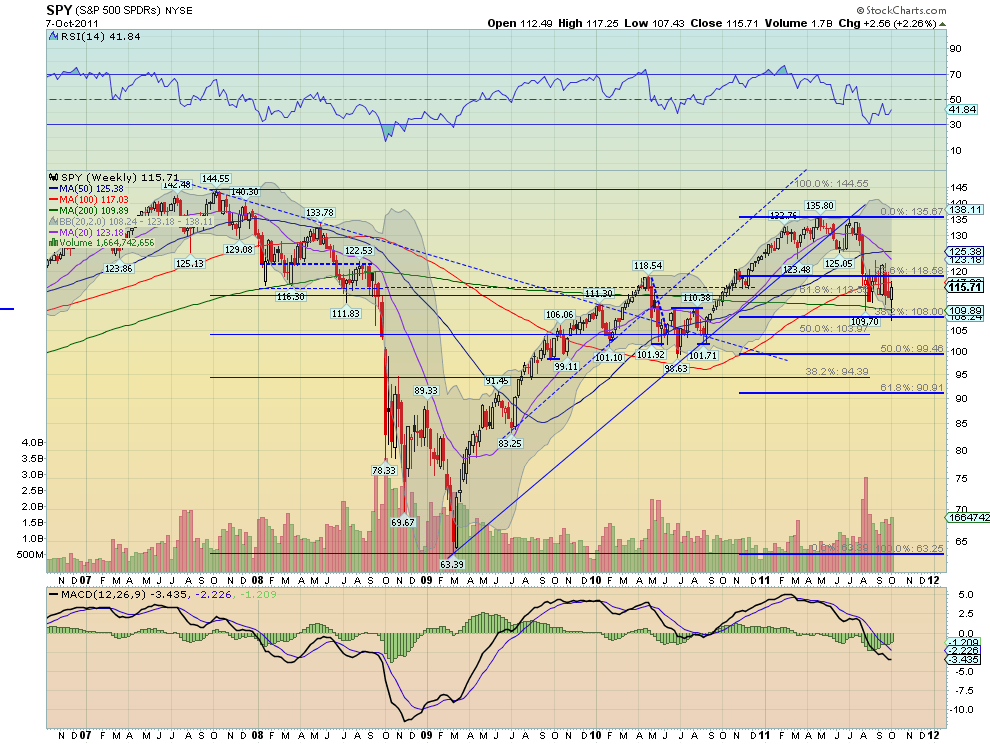
The SPY had an amazing week, falling out of the bear flag and making a new low, before rocketing over 9% and retesting the flag, and then pulling back Friday. It is morphing into a downward channel on the daily chart, with an RSI that remains bearish, failing to break even the mid line on the move higher, and a MACD that has just crossed positive. It remains below all of the SMA on this timeframe as well. The weekly chart looks like a shadow piercing below the flag but no real change. The RSI is struggling under the mid line while the MACD is improving. The trend remains down.
Next week looks for Gold and Crude Oil to continue in their downward trends with the possibility that Gold continues its flag. The US Dollar Index loos ready to continue higher while Treasuries could pullback further in their up trend. The Shanghai Composite will reopen after a week off and biased to continue lower along with Emerging Markets. Volatility should remain elevated, and the Equity Index ETF’s SPY, IWM and QQQ continue to be biased lower morphing from their bear flags into downward channels. Use this information as you prepare for the coming week and trade’m well.
Click the Get Premium button and sign up for the service to get access to the Full Version with 20 detailed charts and analysis: Macro Week in Review/Preview October 8, 2011
If you like what you see above sign up for deeper analysis and trading strategy by using the Get Premium button above. As always you can see details of individual charts and more on my StockTwits page.
The information in this blog post represents my own opinions and does not contain a recommendation for any particular security or investment. I or my affiliates may hold positions or other interests in securities mentioned in the Blog, please see my Disclaimer page for my full disclaimer.
blog comments powered by Disqus
-
 Gregory W. Harmon CMT, CFA, has traded since 1986 and held senior positions including Head of Global Trading, Head of Product Development, Head of Strategy and Director of Equity. (More)
 -
Subscribe to Dragonfly Capital Views
Lifetime Subscription
$4,000.00Sign upAnnual Subscription
$1,000.00Sign upQuarterly Subscription
$350.00Sign up
Recent Posts
- SPY Trends and Influencers October 10, 2026
- Macro Week in Review/Preview October 9, 2026
- Bull Scan for 10-12-26
- How this Week’s Premium Top 10 Performed, October 9, 2026
- Bull Scan for 10-9-26
- Bull Scan for 10-8-26
- Bull Scan for 10-7-26
- Premium Earnings 10-6-26: Constellation Brands
- Bull Scan for 10-6-26
- 5 Trade Ideas for Monday: CIENA, F5, Generac, Goldman Sachs and Marathon Petroleum
Archives