SPDR Sector Review/Preview: A New Beginning
- Posted by Greg Harmon
- on November 6th, 2010
This week could have been the start of something big. The sector leaders are changing from the defensive sectors to more bullish sectors. Let’s take a look at the weekly charts to see what is happening.
Who Got Us Here
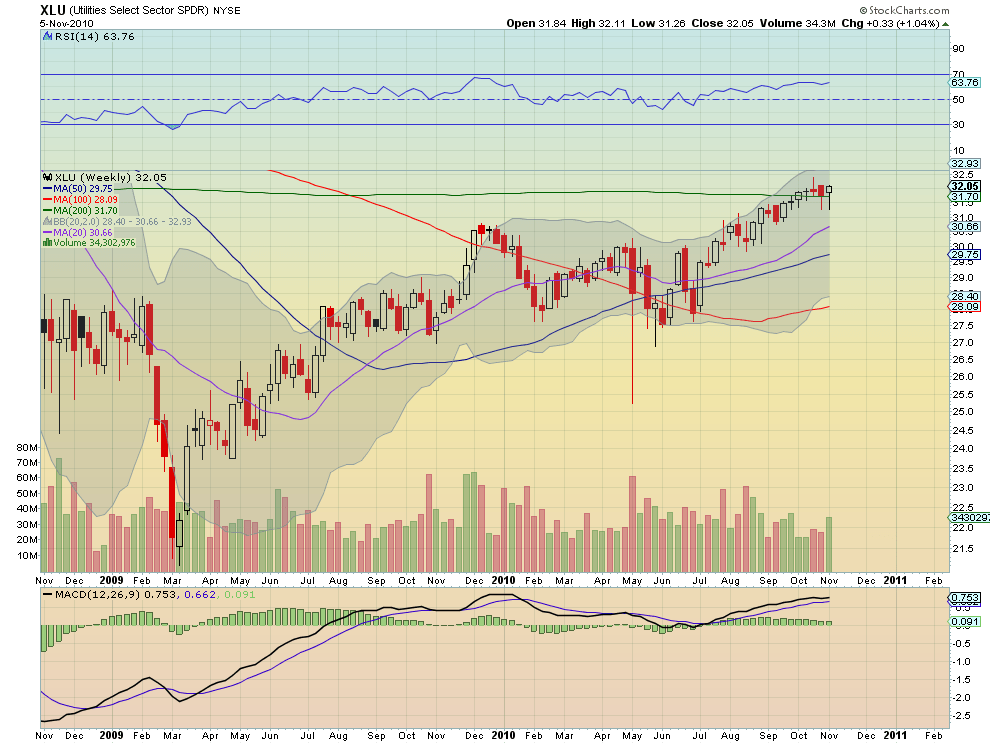
Two sectors that have been leading this move higher have been Utilities and Health Care.
Utilities Select Sector SPDR, XLU Weekly Chart
Health Care Select Sector SPDR, XLV Weekly Chart

Notice that the Utilities sector was the early leading having started its move higher in July, well ahead of the market as a whole. Health Care bottomed in mid August and started higher from there. Both of these sectors are now looking a little tired on their weekly charts. Utilities have flattened right at the 200 week Simple Moving Average (SMA). Health Care is a bit better but is also showing some topping in its price action.
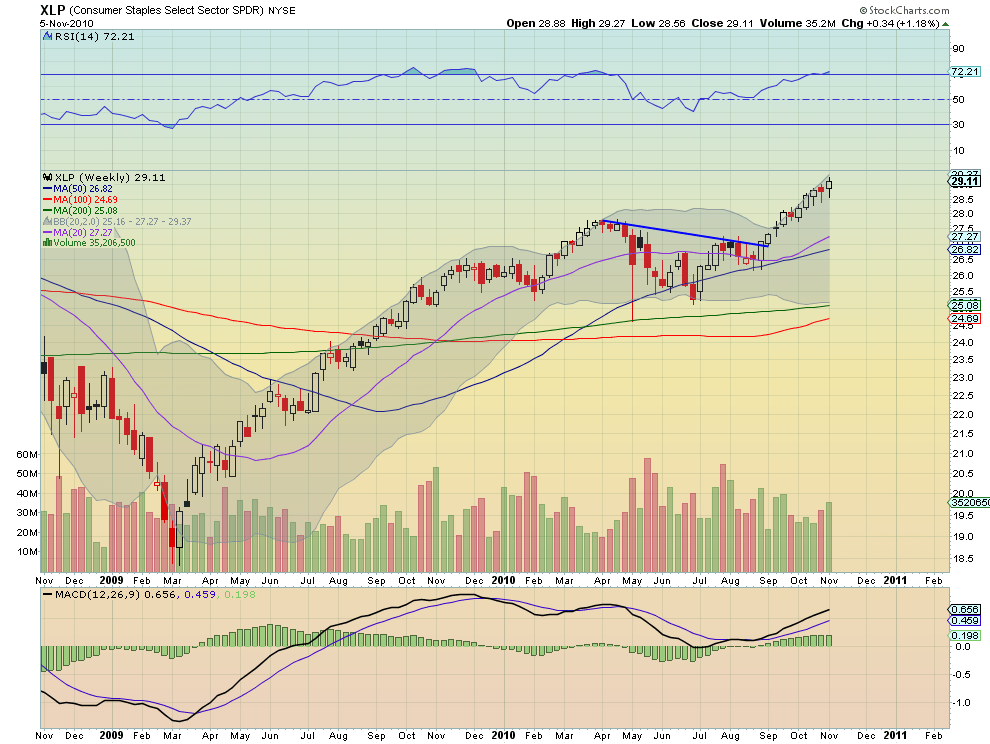
The third sector that has been a leader has been the Consumer Staples. This sector still looks to have some strength on the weekly chart but is moving into overbought territory. It’s daily chart shows a bit of a slowdown this past week with the Relative Strength Index (RSI) rolling over and the Moving Average Convergence Divergence (MACD) showing a bearish cross.
Consumer Staples Select Sector SPDR, XLP Weekly Chart
Consumer Staples Select Sector SPDR, XLP Daily Chart

Who Can Take Us Higher
The Technology sector has been helping out all along and looks to continue.
Technology Select Sector SPDR, XLK Weekly Chart

The Materials and Industrials sectors are now looking to help pull the market higher. Here are their weekly charts.
Materials Select Sector SPDR, XLB Weekly Chart

Industrials Select Sector SPDR, XLI Weekly Chart

Notice how the MACD and RSI are rising in both of these charts along with the price action. They are also sticking to the top of the Bollinger Bands, a sign of a strong trend higher. The final player that could help this market higher is the Financial sector. This sleeping giant woke up this week. and appears ready to play.
Financials Select Sector SPDR, XLF Weekly Chart
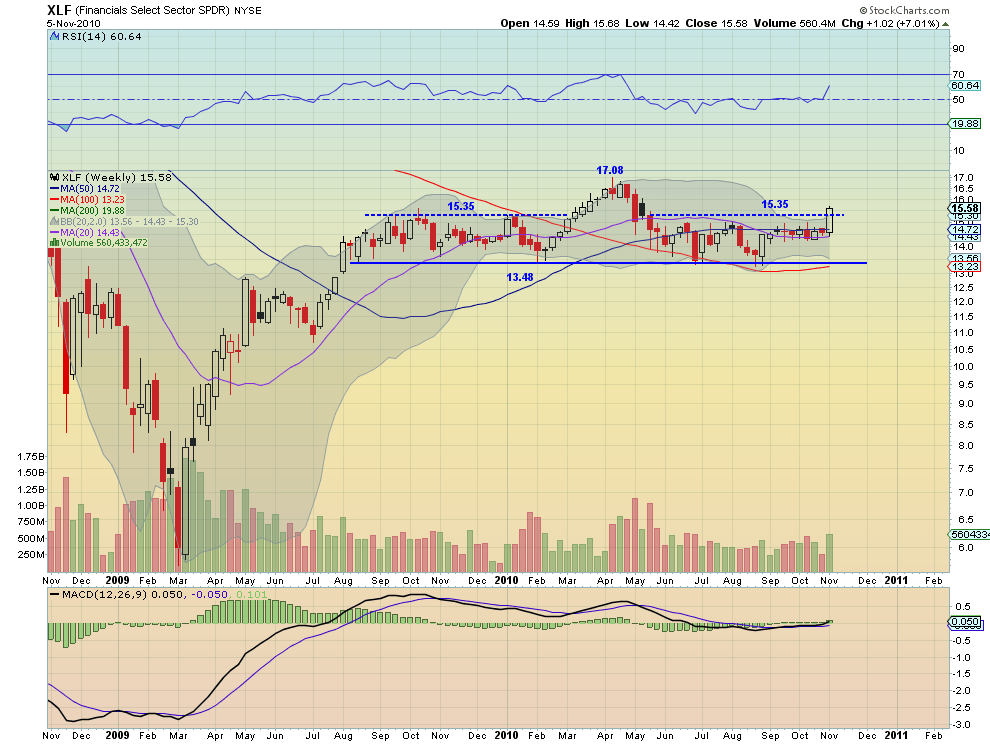
This is really exciting as the Financials have been resting on the bench since May. If they can get going they could have a sizable move ahead of them.
What Does This Mean?
What does it mean that the Financials, Industrials, Materials and Technology sectors may be taking over from the defensive Consumer Staples, HealthCare and Utilities. Look at the chart of the business and market cycle below.
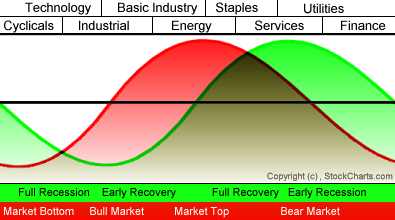
From a market cycle perspective (in red) it indicates a bottoming pattern, a spring board for the market to go higher. This is great news for investors and trend followers. From an economic cycle perspective the news is not so good and could be the first signs of a coming double dip. So maybe we can all be depressed that there are no jobs and the depression, I mean recession, may get worse as we get filthy rich in the stock market. I am not predicting that these trends outlined above are going to continue or accelerate, or that history will repeat itself this time. Rather I wish to point out that a change may be starting to help you get ready. Trade’m well.
(As always you can see details of these individual charts and more on my twitter feed and on chartly.)
If you like what you see above sign up for deeper analysis and trading strategy by using the Get Premium button above. As always you can see details of individual charts and more on my StockTwits page.
The information in this blog post represents my own opinions and does not contain a recommendation for any particular security or investment. I or my affiliates may hold positions or other interests in securities mentioned in the Blog, please see my Disclaimer page for my full disclaimer.
blog comments powered by Disqus
-
 Gregory W. Harmon CMT, CFA, has traded since 1986 and held senior positions including Head of Global Trading, Head of Product Development, Head of Strategy and Director of Equity. (More)
 -
Subscribe to Dragonfly Capital Views
Lifetime Subscription
$4,000.00Sign upAnnual Subscription
$1,000.00Sign upQuarterly Subscription
$350.00Sign up
Recent Posts
- Bull Scan for 10-14-26
- Premium Earnings 10-13-26: Fastenal and Morgan Stanley
- Bull Scan for 10-13-26
- Premium Earnings 10-12-26: Citigroup and Johnson & Johnson
- 4 Trade Ideas Wells Fargo: Bonus Idea
- 5 Trade Ideas for Monday: AbbVie, Airbnb, Affirm, GE Aerospace and Walmart
- Top Trade Ideas for the Week of October 12, 2026: The Rest Premium
- Top Trade Ideas for the Week of October 12, 2026: The Best
- SPY Trends and Influencers October 10, 2026
- Macro Week in Review/Preview October 9, 2026
Archives