Sector Review: Four Themes from the Week
- Posted by Greg Harmon
- on February 5th, 2011
Five themes jumped out at me from the SPDR Sector charts this week and give some clues as to what to expect next week. The four that can be found in the individual charts are described below. The last one is an amalgamation of them all, and I will share later. Let me show you what struck me from the charts.
1. Energy Remains The Fuel
The first theme is that the energy sector still looks great. Just look at the chart of Energy Select Sector SPDR, XLE, below.

This chart reminds me of that great leader charging out in front to do battle, with the troops trying to keep up. XLE has lead the rally from the beginning doing nothing but charging up. This is probably why it seemed like weakness when all it did was consolidate this week after moving higher Monday. The chart shows a perfect bull flag developed this week, with strong volume on the move higher waning as it consolidates. The Relative Strength Index (RSI) is in the overbought condition, but not excessive, and the flag is already helping to work that off. A bit more consolidation would be welcome. The Moving Average Convergence Divergence (MACD) indicator is starting to fall, indicating that the flag may continue next week. The Bollinger bands are expanding as this is happening making room for the next leg higher. Nothing here looks tired, maybe just a water break before hitting stride again.
2. Building Blocks are Being Assembled
Four sectors Materials Select Sector SPDR, XLB, Industrials Select Sector SPDR, XLI, Technology Select Sector SPDR, XLK and Health Care Select Sector SPDR, XLV, missed the first step Monday by XLE but followed close behind and are hitting new highs now. I call them building blocks because these sectors are the pieces that drive the growth and innovation in the economy and the market. Look at the chart of XLK below.
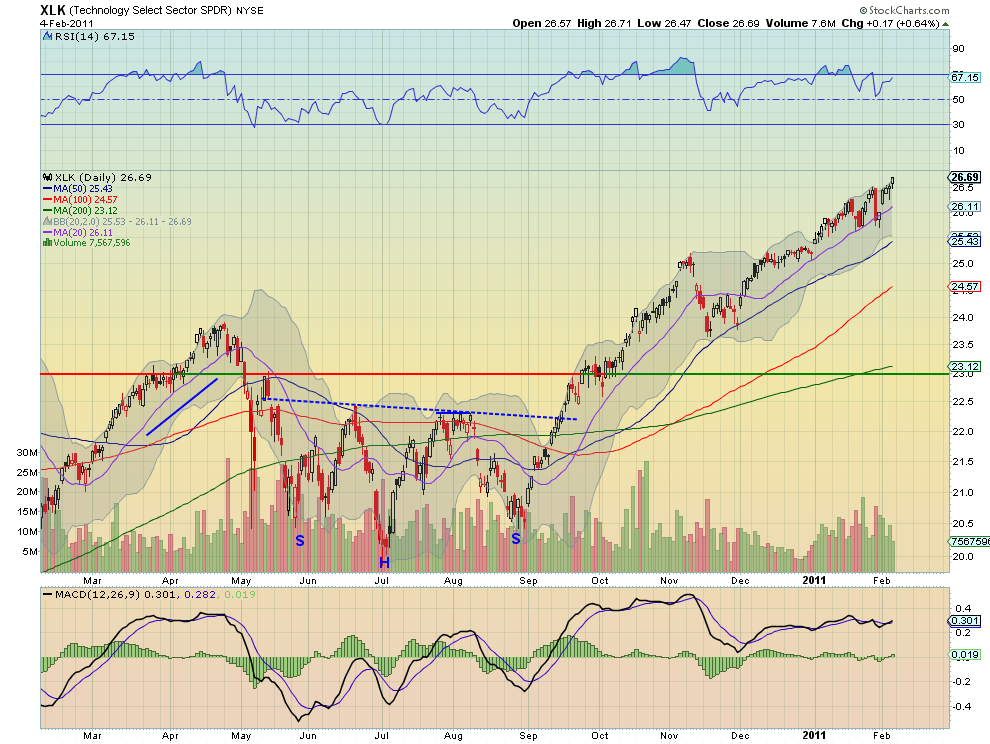
This chart typifies these sectors recently. Notice the strong move down last Friday was followed by a pause before a strong move higher and then gradual rise to new highs at the end of the week. The RSI got crushed on the down move but has recovered and back in the strong bullish territory. The MACD also improved all week after peaking to the downside last Friday and has just crossed bullishly up. It is pressing the top of the Bollinger bands and expanding them. These sectors look poised to continue higher now that they are making new highs.
3. Consumption is Joining
Two sectors Consumer Staples Select Sector SPDR, XLP and Consumer Discretionary Select Sector SPDR, XLY, represent all of Consumption and these sectors took a little longer to join the move this week but exhibited steady progress higher. Below is the chart of XLY.
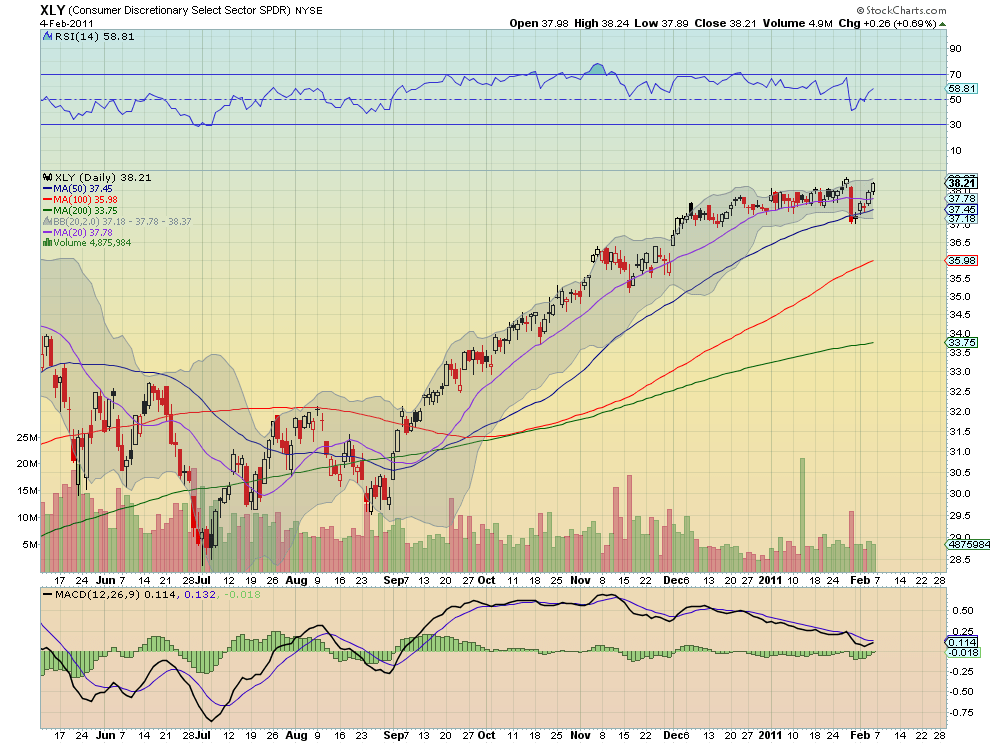
Notice how similar it is the chart of XLK above but that this past week there was not a quick move higher but rather a slow climb. Additionally this chart shows that the RSI still has much room to run higher before reaching the technically overbought condition, with the MACD improving and moving towards a bullish cross up. Finally the Bollinger bands have expanded this week allowing for more upside. Look for these 2 sectors to continue to move higher next week, testing their recent highs.
4. Just Needs Some More Grease
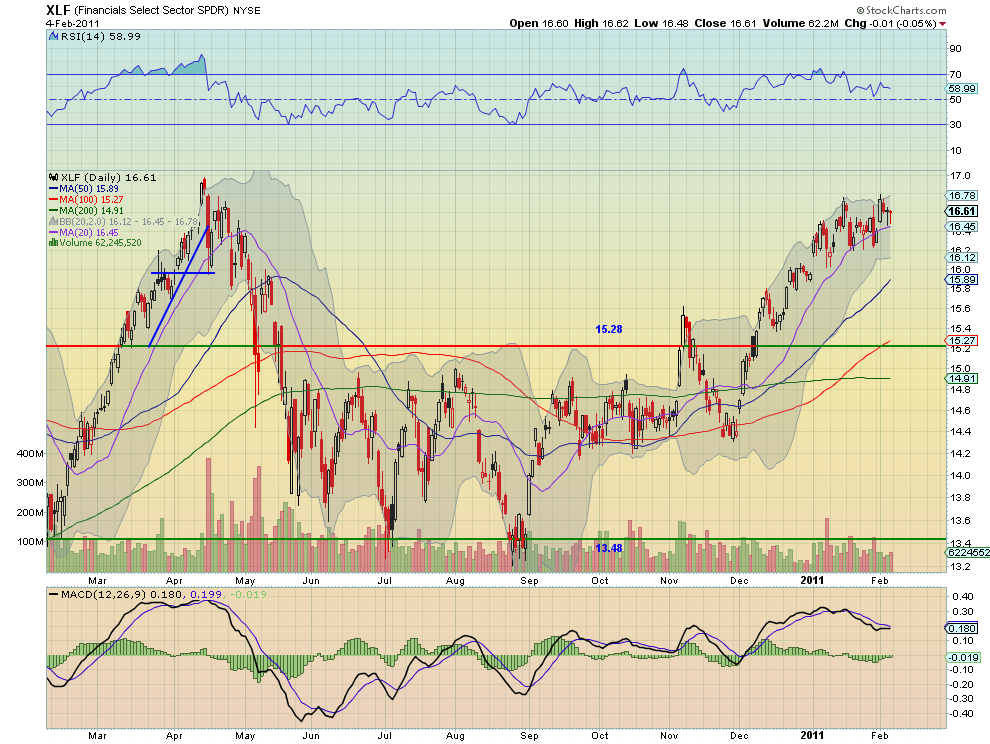
The Financials Select Sector SPDR, XLF and Utilities Select Sector SPDR, XLU provided some grease to the system on Tuesday, moving higher but it leaked out by the end of week with them finishing lower. The XLF chart below shows the RSI trending lower during the week and over the last month. The price is sitting on support of the 20 day Simple Moving Average (SMA) after printing two candles that are probing lower. The Exponential Moving Averages (EMA’s) making up the MACD are approaching each other but not giving any clear indication that a cross is about to occur. If these sectors can plug the leak and move higher the grease they provide will benefit the entire market. It is not clear right now that will happen.
As always you can see details of individual charts and more on my StockTwits feed and on chartly.)
If you like what you see above sign up for deeper analysis and trading strategy by using the Get Premium button above. As always you can see details of individual charts and more on my StockTwits page.
The information in this blog post represents my own opinions and does not contain a recommendation for any particular security or investment. I or my affiliates may hold positions or other interests in securities mentioned in the Blog, please see my Disclaimer page for my full disclaimer.
blog comments powered by Disqus
-
 Gregory W. Harmon CMT, CFA, has traded since 1986 and held senior positions including Head of Global Trading, Head of Product Development, Head of Strategy and Director of Equity. (More)
 -
Subscribe to Dragonfly Capital Views
Lifetime Subscription
$4,000.00Sign upAnnual Subscription
$1,000.00Sign upQuarterly Subscription
$350.00Sign up
Recent Posts
- Premium Earnings 10-13-26: Fastenal and Morgan Stanley
- Bull Scan for 10-13-26
- Premium Earnings 10-12-26: Citigroup and Johnson & Johnson
- 4 Trade Ideas Wells Fargo: Bonus Idea
- 5 Trade Ideas for Monday: AbbVie, Airbnb, Affirm, GE Aerospace and Walmart
- Top Trade Ideas for the Week of October 12, 2026: The Rest Premium
- Top Trade Ideas for the Week of October 12, 2026: The Best
- SPY Trends and Influencers October 10, 2026
- Macro Week in Review/Preview October 9, 2026
- Bull Scan for 10-12-26
Archives