Revised: Preparing for a Flow from Energy into Financials
- Posted by Greg Harmon
- on March 8th, 2011
I realize many did not see this when originally posted Tuesday night due to some technical issues, but it still holds. Since originally posted the XLE has continued to rollover and XLF has been flat, but idea 3 below is triggering. Here is the original post:
Today’s action could be the first sign that there is a shift from the Energy sector (XLE) into the Financial sector (XLF). Or it might not be. But since every ‘expert’ thinks that is coming lets examine how to prepare for it. First the clues.

XLE has had a hard time continuing its move higher the last week, and recently the Relative Strength Index (RSI) is making lower lows. The Moving Average Convergence Divergence (MACD) indicator is now moving lower and has crossed down. Maybe it is cracking. But on the other hand it has just found support at the 20 day Simple Moving Average (SMA). It is still in the top half of the Bollinger bands and all the SMA’s are sloping higher. So maybe it is just in a pullback within the uptrend. The jury it out. What about XLF?
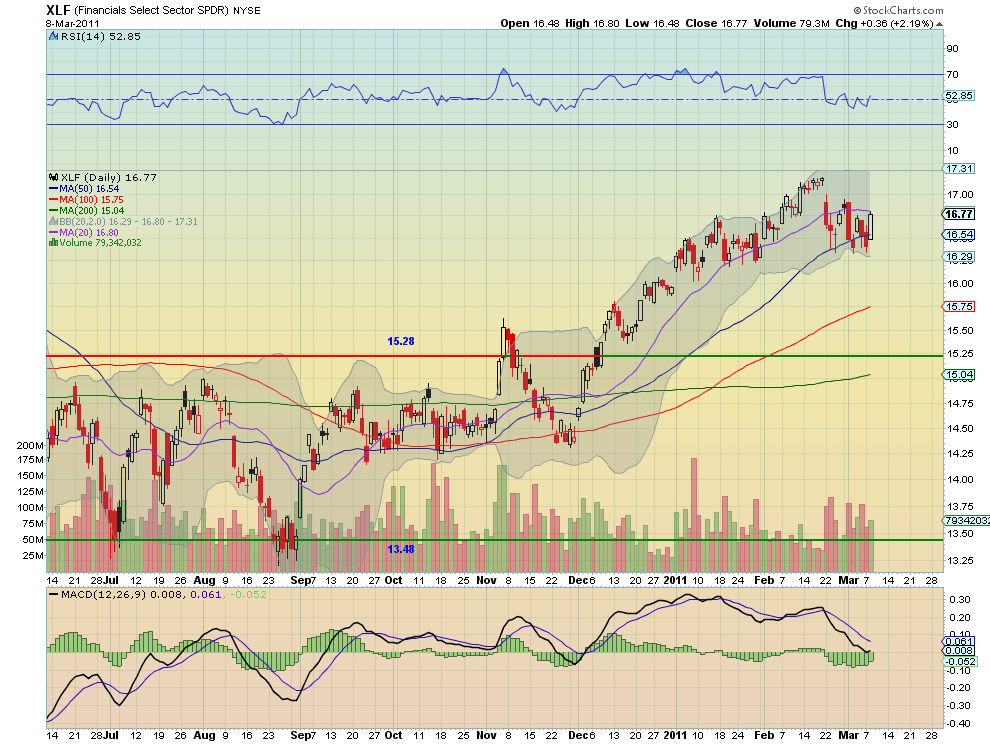
XLF closed at a new higher high today. It also has the RSI rising off of the mid line into bullish territory and the MACD is beginning to improve. Looks like it might be time for this to move up. But on the other hand it could not get through the 20 day SMA and the SMA’s are fairly flat, and it has not moved above the middle of the Bollinger ban range. This indicates that there is still some work to be done to get higher.
So XLE may be ready to fall or it may not. And XLF might be getting ready to rise but has some work. This is best played by a pairs trade.

The chart above shows the ratio of XLE to XLF over the last year. The technical analysis on this chart reflects many of the same points of uncertainty. There was a big pullback today, but it held at the gap up level from about two weeks ago at 4.58, with a bullish hammer candle that just touched the 20 day SMA. There is also support underneath at the Fibonacci level at 4.49. There are three ways to play this pair depending on how it moves tomorrow.
1. If the Hammer confirms tomorrow then buy XLE and sell XLF in the ratio of 4.6:1 (long 500 XLE and short 2300 XLF) and keep it on until it tests the high again at 4.83. The stop for the trade would be a ratio of 4.58.
2. If it moves lower then stay in cash.
3. If the ratio falls below the 4.49 Fibonacci level then reverse the trade above, selling XLE and buying XLF in a ratio of 4.5:1 (short 200 XLE and long 900 XLF) and hold it until the ratio tests support at 4.40 or the 4.29 Fibonacci level lower. The stop on this trade is a ratio of 4.50.
So it turns out that it does not matter if there is a flow from Energy to Financials or not. As long as both do not stay where they are right now then there is a low risk opportunity to play the pair. Trade’m well.
(As always you can see details of individual charts and more on my StockTwits feed and on chartly.)
If you like what you see above sign up for deeper analysis and trading strategy by using the Get Premium button above. As always you can see details of individual charts and more on my StockTwits page.
The information in this blog post represents my own opinions and does not contain a recommendation for any particular security or investment. I or my affiliates may hold positions or other interests in securities mentioned in the Blog, please see my Disclaimer page for my full disclaimer.
blog comments powered by Disqus
-
 Gregory W. Harmon CMT, CFA, has traded since 1986 and held senior positions including Head of Global Trading, Head of Product Development, Head of Strategy and Director of Equity. (More)
 -
Subscribe to Dragonfly Capital Views
Lifetime Subscription
$4,000.00Sign upAnnual Subscription
$1,000.00Sign upQuarterly Subscription
$350.00Sign up
Recent Posts
- Bull Scan for 10-13-26
- Premium Earnings 10-12-26: Citigroup and Johnson & Johnson
- 4 Trade Ideas Wells Fargo: Bonus Idea
- 5 Trade Ideas for Monday: AbbVie, Airbnb, Affirm, GE Aerospace and Walmart
- Top Trade Ideas for the Week of October 12, 2026: The Rest Premium
- Top Trade Ideas for the Week of October 12, 2026: The Best
- SPY Trends and Influencers October 10, 2026
- Macro Week in Review/Preview October 9, 2026
- Bull Scan for 10-12-26
- How this Week’s Premium Top 10 Performed, October 9, 2026
Archives