Playing Google on the Short Side for No Risk*
- Posted by Greg Harmon
- on April 5th, 2011
(*Well there is some risk but we will get to that.)
Google (ticker:$GOOG) was off more than $20 at one point Tuesday but recovered a bit later in the day to close down only $18 and change. There was talk in the market of it being out of favor with the trading community. But what does the chart say and how can you profit from it.
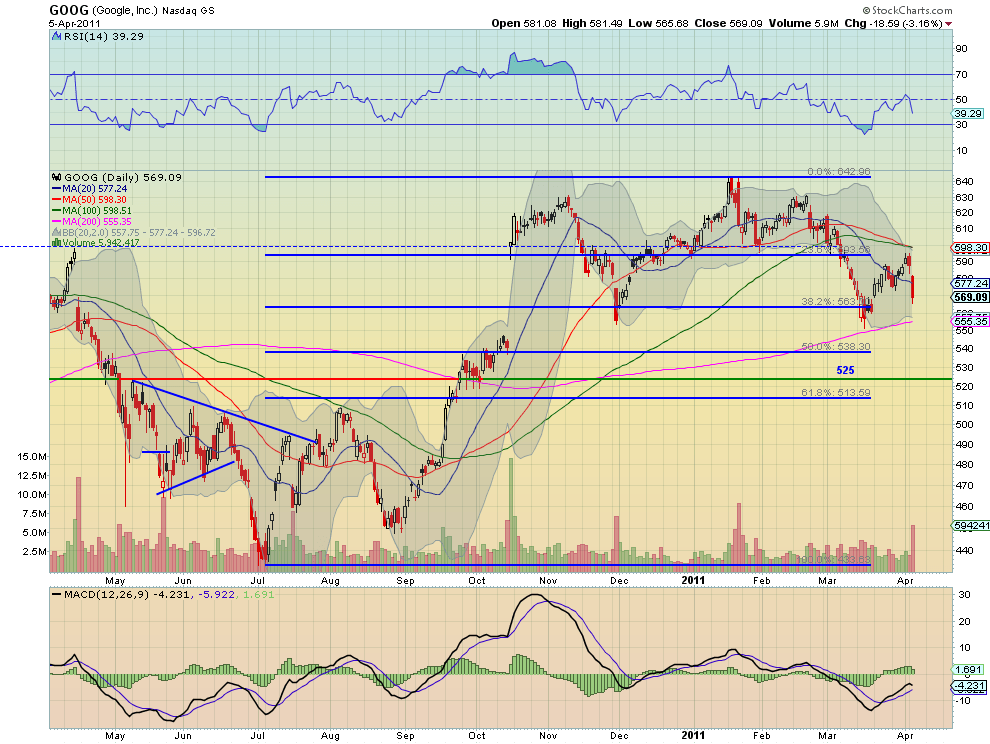
The daily chart above shows the violent move down, but also that there looks to be more downside to come with support showing up at the bottom of the Bollinger bands and rising 200 day Simple Moving Average (SMA) at 555. This is also the low close on November 30, 2010 and support from mid March. The Relative Strength Index (RSI) rejected off of the mid line and has lots of downside room before being oversold and the Moving Average Convergence Divergence (MACD) is fading, both supporting further downside. On a Measured Move comparable to the move from 630 down to 555 over February to March, the downside target is through the 50% Fibonacci at 538 to 520. This is not far from the longer term support/resistance line at 525 and there is also the 61.8% Fibonacci retracement at 513 nearby.
That is a lot of short potential, but it takes a lot of margin to short a $570 stock. You can get around that by using options to reduce the margin and risk in the trade while keeping a significant payoff potential. Three Strikes matched up with support levels on the chart pretty closely: 555, 535 and 525. By using these Strikes to create a Put Spread you can get paid a credit to have $20 potential return on a Google fall and have no risk exposure until it breaks 505. Let me explain.
Trade: Buy 1 May 555 Put, Sell 1 May 535 Put and 1 May 525 Put
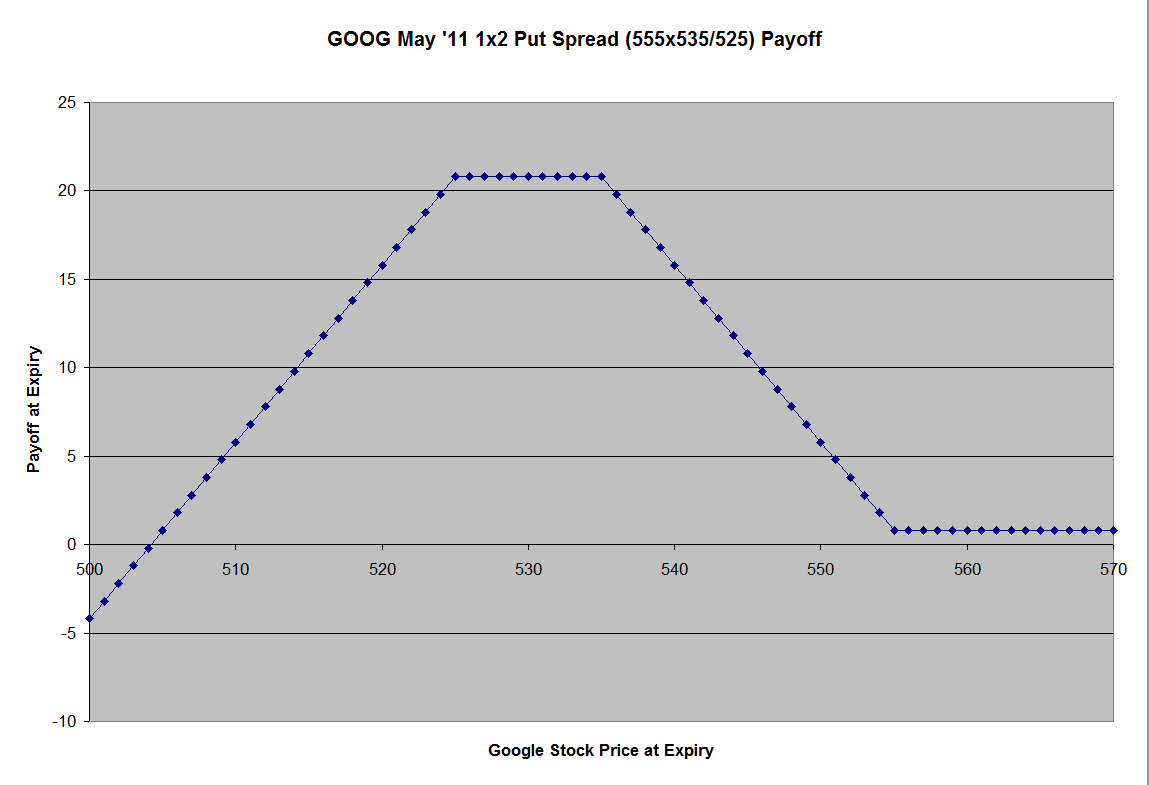
This is a ratio put spread in that you are long 1 put and short 2 lower strike puts and technically gives you long exposure, but at a price below the lowest strike put sold. I put this trade on today and was paid an 80 cent credit to do it, which was still available near the close. The payoff graph below shows the maximum payoff of $20.80 is if Google closes between 525 and 535 on May Expiry. From there it trails off to breakeven just under 505. Any close under 525 would have the stock put to you but by selling it immediately you retain profits as long as the stock is above 505. If Google close above 555 then all the options expire worthless and you keep the credit of 80 cents. The margin required for this trade at Interactive Brokers was $7,752 per spread, versus $9,313 to short a 100 shares of stock, and the best part is that if it expires worthless you get an 8.37% gross return on the margin over 45 days.
This trade is not for everyone. You need margin, you need to be able to short naked puts in your account and you need to be willing to own Google at a basis of 505. But if your risk profile fits, this is a less risky way to profit from a fall in the stock price. Come join me, the water is fine!
As always you can see details of individual charts and more on my StockTwits feed and on chartly.)
If you like what you see above sign up for deeper analysis and trading strategy by using the Get Premium button above. As always you can see details of individual charts and more on my StockTwits page.
The information in this blog post represents my own opinions and does not contain a recommendation for any particular security or investment. I or my affiliates may hold positions or other interests in securities mentioned in the Blog, please see my Disclaimer page for my full disclaimer.
blog comments powered by Disqus
-
 Gregory W. Harmon CMT, CFA, has traded since 1986 and held senior positions including Head of Global Trading, Head of Product Development, Head of Strategy and Director of Equity. (More)
 -
Subscribe to Dragonfly Capital Views
Lifetime Subscription
$4,000.00Sign upAnnual Subscription
$1,000.00Sign upQuarterly Subscription
$350.00Sign up
Recent Posts
- 4 Trade Ideas Wells Fargo: Bonus Idea
- 5 Trade Ideas for Monday: AbbVie, Airbnb, Affirm, GE Aerospace and Walmart
- Top Trade Ideas for the Week of October 12, 2026: The Rest Premium
- Top Trade Ideas for the Week of October 12, 2026: The Best
- SPY Trends and Influencers October 10, 2026
- Macro Week in Review/Preview October 9, 2026
- Bull Scan for 10-12-26
- How this Week’s Premium Top 10 Performed, October 9, 2026
- Bull Scan for 10-9-26
- Bull Scan for 10-8-26
Archives