Pick Up Knives Instead of Catching Them, Its Less Bloody: F5 Networks
- Posted by Greg Harmon
- on February 3rd, 2011
Some times picking a fallen knife up off the floor can be just as lucrative as catching it half an inch above the floor, only a lot safer. F5 Networks (Ticker: FFIV) is a good case study. Following their earnings report two weeks ago FFIV stock got taken to the woodshed for a beating, losing $30. Take a look at the daily chart below.

Prior to the massive sell off, FFIV had risen in a wedge pattern, out of an upward channel that goes back to June 2009. After falling out of the wedge, the top rail of the channel held as support for over one month. But look what happened when it gapped down after the earnings report. The drop stopped at the bottom rail of that channel. In the two weeks since then it has held support at that rail while the Relative Strength Index (RSI) has worked off an oversold condition, and the Moving Average Convergence Divergence (MACD) indicator has come off of its peak negative reading and is approaching zero. The MACD looks like it could be heading for a bullish cross very soon. The story could get more bullish if it could close above 115, breaking the support area from late October and November 2010. At that point resistance at 125 and then 130 come into the picture. An aggressive trader might go long on the first break of 115 with a tight stop, but that is getting ahead of ourselves, what about the bigger picture. Look at the weekly chart below.
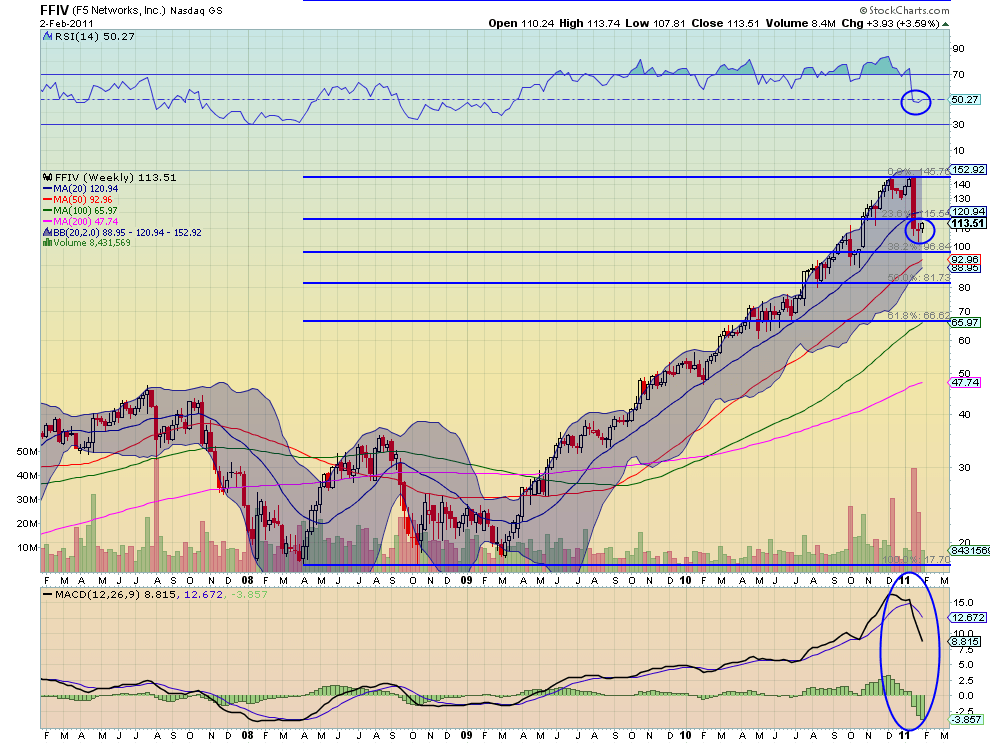
The daily gap down move is captured by a big red candle on the weekly chart that retraced more than 25% of the move up. Focus on the three highlighted areas within the circles starting with price. The bullish Hammer candle from last week is the first positive sign for a reversal. It appears to be confirming this week with 2 days to go, but it would be nicer to see it above 115.54, the Fibonacci line. Remember there is an economic catalyst Friday that could bring the whole market one direction or another so the weekly candle can not be counted on until complete. It could also be interpreted as a bear flag and if it starts to fall again a natural stopping point might be the 38.2% retracement of the up move at 96.84, over $16 lower from here. The weekly RSI shows it has been in bullish territory since April 2009 and the area circled shows that the pullback did not change that, bouncing at the mid line. This is also a positive sign for a reversal. But the RSI is not yet pointing strongly higher, rather it is flat, so it might just as easily turn lower again and break through that mid line. Finally the MACD still looks bearish. The indicator has been growing more negative since before the fall and shows no signs of slowing yet.
Bottom line: wait for the confirmation signs. It is not a requirement that all these indicators line up before the price can reverse, but it makes the case much stronger if they do. At a minimum anyone other than an aggressive day trader should probably wait to pick up this fallen knife until after the weekly candle confirms the Hammer and the price closes above 115.54. Could be less bloody. Trade’m well.
As always you can see details of individual charts and more on my StockTwits feed and on chartly.)
If you like what you see above sign up for deeper analysis and trading strategy by using the Get Premium button above. As always you can see details of individual charts and more on my StockTwits page.
The information in this blog post represents my own opinions and does not contain a recommendation for any particular security or investment. I or my affiliates may hold positions or other interests in securities mentioned in the Blog, please see my Disclaimer page for my full disclaimer.
blog comments powered by Disqus
-
 Gregory W. Harmon CMT, CFA, has traded since 1986 and held senior positions including Head of Global Trading, Head of Product Development, Head of Strategy and Director of Equity. (More)
 -
Subscribe to Dragonfly Capital Views
Lifetime Subscription
$4,000.00Sign upAnnual Subscription
$1,000.00Sign upQuarterly Subscription
$350.00Sign up
Recent Posts
- Premium Earnings 10-13-26: Fastenal and Morgan Stanley
- Bull Scan for 10-13-26
- Premium Earnings 10-12-26: Citigroup and Johnson & Johnson
- 4 Trade Ideas Wells Fargo: Bonus Idea
- 5 Trade Ideas for Monday: AbbVie, Airbnb, Affirm, GE Aerospace and Walmart
- Top Trade Ideas for the Week of October 12, 2026: The Rest Premium
- Top Trade Ideas for the Week of October 12, 2026: The Best
- SPY Trends and Influencers October 10, 2026
- Macro Week in Review/Preview October 9, 2026
- Bull Scan for 10-12-26
Archives