Mining the Gold Miners: Hecla vs Ivanhoe
- Posted by Greg Harmon
- on February 1st, 2011
Updated the charts, not text on February 5, 2011, but not text. This pair looks even better now:
Metals have been beaten up lately and have taken many of the mining stocks with them. There are some bright spots though. But with many predicting a correction coming, the commodities space, the recent high flyer, could remain in the crosshairs. How can you take advantage of the bright spots? With a pairs trade. Below is a chart of Hecla Mining (Ticker: HL).
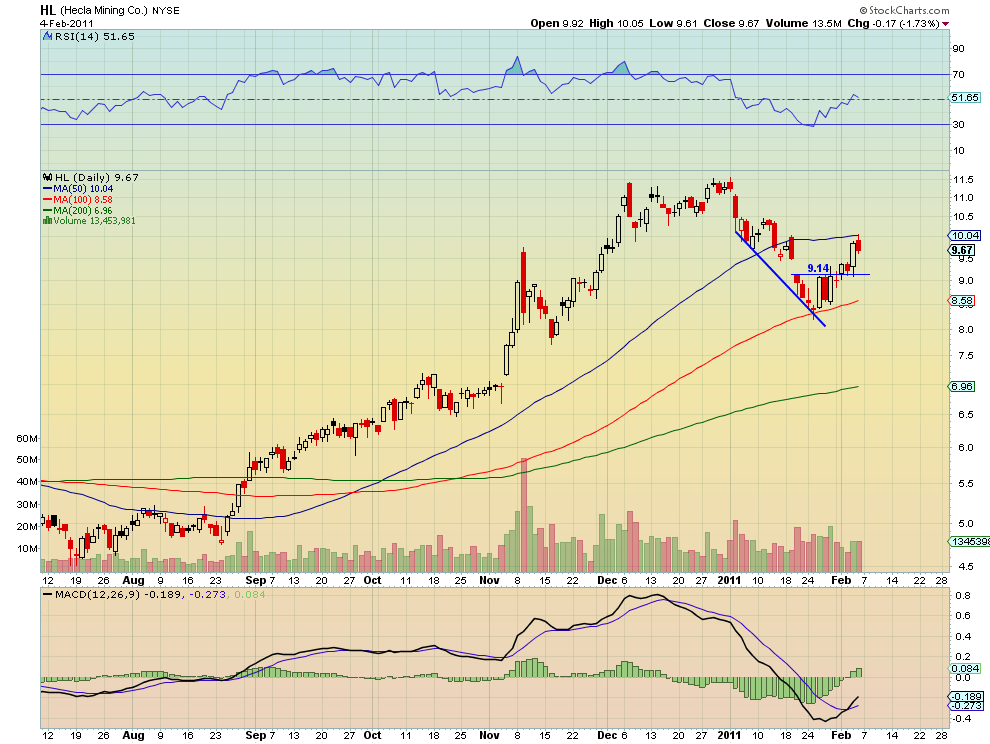
This stock has pulled back with Gold but found a bottom on the 100 day Simple Moving Average (SMA). It has recently been trying to break through resistance at the 9.14 area and has positive support from an Relative Strength Index (RSI) that has bounced off the technically oversold line and is rising, as well as an improving Moving Average Convergence Divergence (MACD) indicator. If it can get through 9.14 it could fill the gap up to 9.50 and then find resistance at the 50 day SMA near 10. But there is that correction fear. Now look at the chart below of Ivanhoe Mines (Ticker: IVN).

This chart shows some similar aspects to the HL chart, with a rising RSI and MACD but they all happened about a week ago. the move in IVN has failed so far to break to new highs above 29.20 and now the MACD is decreasing and the RSI has bounced off of the overbought condition. If it does not hold 27 then the next support is near 26.40 followed by the 50 day SMA at 25.16.
Trade Idea: Buy 3 lots HL and sell short 1 lot of IVN
You can take advantage of the strength in HL and the relative weakness in IVN risking little capital with pairs trade above. Take a look at the chart of the ratio of the two stocks prices below.
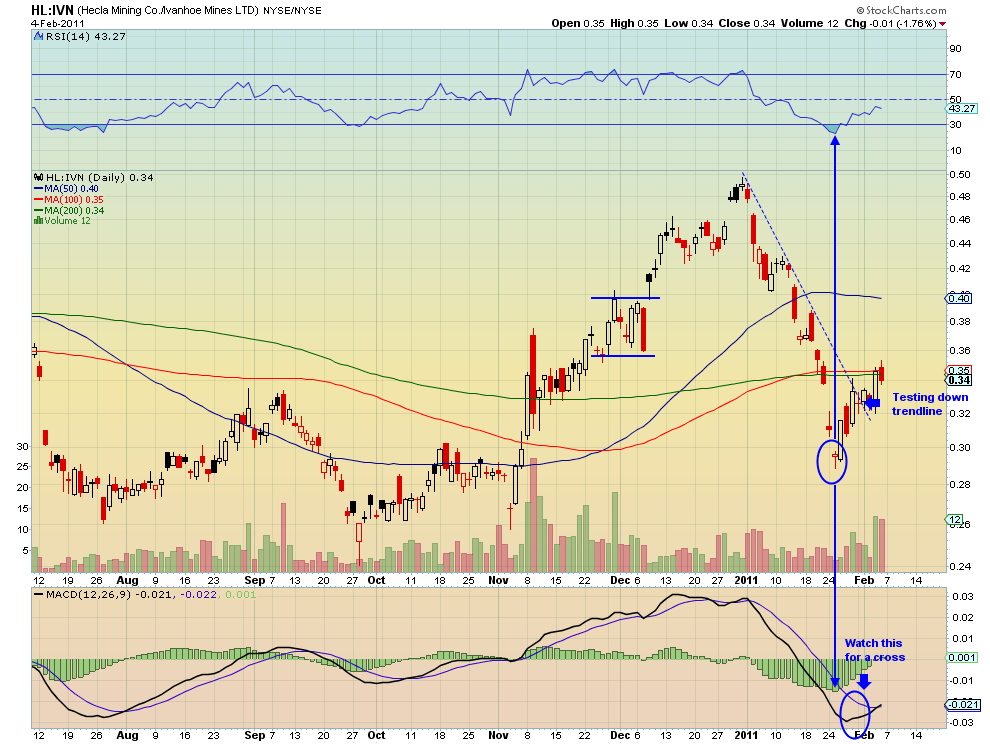
This shows the clear down trend in the ratio beginning at the first of the year. It is now testing that down trendline, while moving higher off of a Hammer candle at the bottom 5 days ago. At that time the MACD peaked to the negative but it has been improving since, while the RSI troughed in oversold territory and has been rising since. A break of this trendline would be a signal to take the trade above with a target of a move up to a ratio of 0.36 and then 0.40 where it moved sideways in December. This may not seem like a big move in the ratio but it represents a $2.63 to $2.84 gain in the trade per pair, for putting up no money. A stop on the trade could be put just under the trend line at a ratio of 0.32, risking $0.48 to $0.50 per pair. Not a bad reward to risk ratio at 5.26:1 or better.
Look for trades like this to reduce your risk and still participate in the upside and trade’m well.
As always you can see details of individual charts and more on my StockTwits feed and on chartly.)
If you like what you see above sign up for deeper analysis and trading strategy by using the Get Premium button above. As always you can see details of individual charts and more on my StockTwits page.
The information in this blog post represents my own opinions and does not contain a recommendation for any particular security or investment. I or my affiliates may hold positions or other interests in securities mentioned in the Blog, please see my Disclaimer page for my full disclaimer.
blog comments powered by Disqus
-
 Gregory W. Harmon CMT, CFA, has traded since 1986 and held senior positions including Head of Global Trading, Head of Product Development, Head of Strategy and Director of Equity. (More)
 -
Subscribe to Dragonfly Capital Views
Lifetime Subscription
$4,000.00Sign upAnnual Subscription
$1,000.00Sign upQuarterly Subscription
$350.00Sign up
Recent Posts
- Premium Earnings 10-13-26: Fastenal and Morgan Stanley
- Bull Scan for 10-13-26
- Premium Earnings 10-12-26: Citigroup and Johnson & Johnson
- 4 Trade Ideas Wells Fargo: Bonus Idea
- 5 Trade Ideas for Monday: AbbVie, Airbnb, Affirm, GE Aerospace and Walmart
- Top Trade Ideas for the Week of October 12, 2026: The Rest Premium
- Top Trade Ideas for the Week of October 12, 2026: The Best
- SPY Trends and Influencers October 10, 2026
- Macro Week in Review/Preview October 9, 2026
- Bull Scan for 10-12-26
Archives