Mine’s Bigger: Big Box Pairs Trade
- Posted by Greg Harmon
- on January 26th, 2011
The big box discount superstores Wal-Mart (Ticker: WMT) and Costco (Ticker: COST) participated in the stock market rally from the beginning in September and are up 20% and 33% respectively. They have also renewed their runs since the beginning of the year. Are they still good opportunities? Maybe but who cares!
Let me explain with a few charts. Below is a chart for WMT.
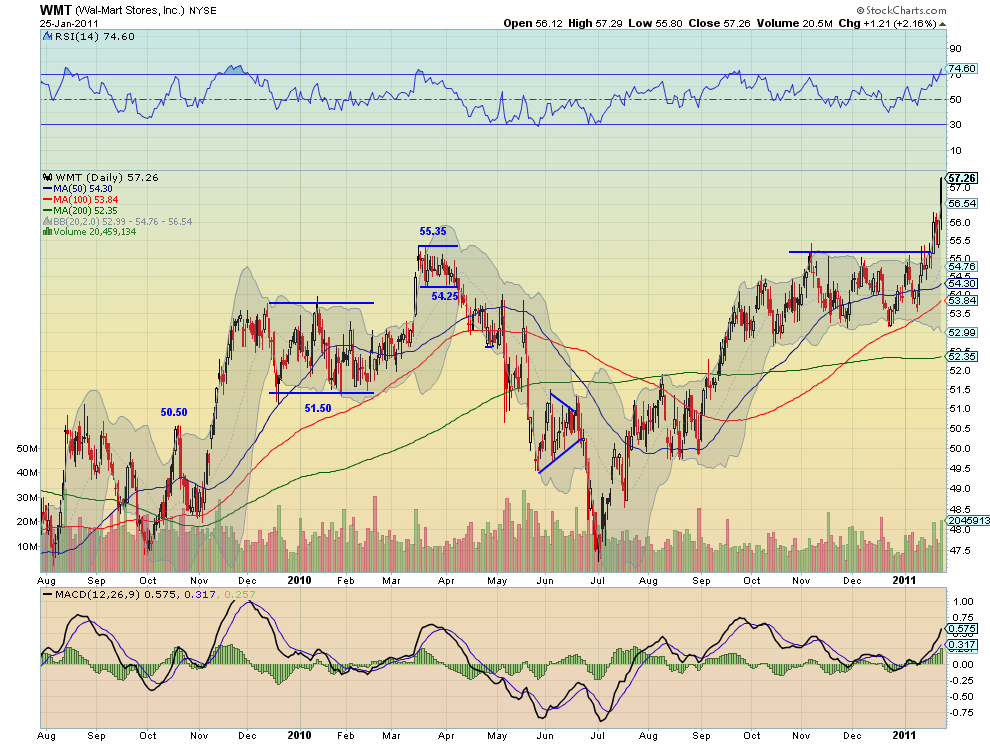
WMT has been rising since the beginning of the year and last week punched through 55.35 resistance area. The price moved $4 from 50.50 to the consolidation area at 54.50 so a target for the break out higher would be 58.50, another $1 higher. It has a rising Moving Average Convergence Divergence (MACD) indicator and Relative Strength Index (RSI) as well. On the negative side of the coin though, it pierced the top of the Bollinger Bands Tuesday and that rising RSI is becoming overbought. What about COST? The chart is below.

COST has also been rising off of support at the 70 level since early this year and is now challenging resistance at 73. If it can get through 73 then the target on a measured move comparable to the move from 61.50 up to the consolidation at 71.50 of $10 would be 81.50. On the negative side of the coin the RSI is peaking and rolling lower and the MACD appears to be avoiding a cross, kissing and moving away, which will create a more negative indicator. Finally the bearish Hanging Man candle printed Tuesday can be an omen for lower prices if if confirmed.
Rather than avoid these stocks until all is clear, there is an opportunity to get involved putting up less capital using a pairs trade. Below is the ratio chart for WMT vs COST.
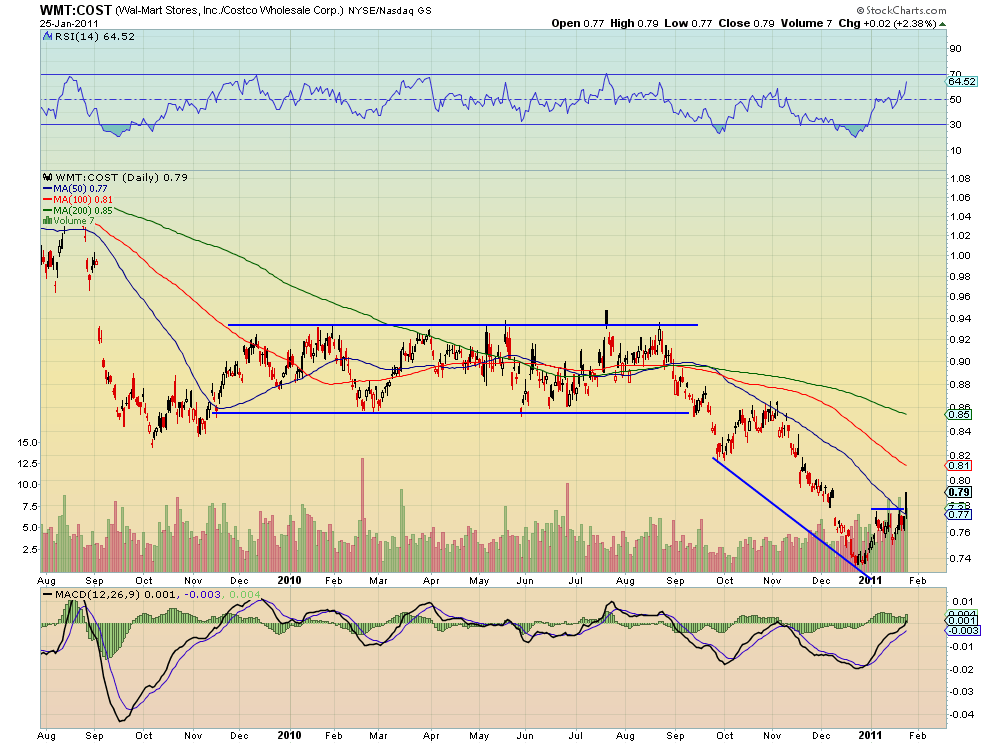
Notice that this pair traded in a tight range for nearly a year between November 2009 and September 2010. At that point COST started to outperform WMT and drove the ratio lower to its trough at year end 2009. In the last two weeks the ratio has come back and stalled at the gap down level at 0.78. During the run off of the bottom the ratio has seen the RSI move progressively higher along with the MACD. Both show room for more upside. Tuesday the ratio broke through the gap and the 50 day SMA. It now has resistance in the 0.81-0.82 are and then the previous channel area at 0.85. That move is a good chunk of change.
Trade Idea: Long 1,000 WMT vs Short 800 COST with a target of the ratio at 0.85 and a stop at 0.77
This is a profit target of $4,080-4,330 against a stop out loss of between $1,465-1,523 and generates a net cash inflow of $708.
Trade’m well!
As always you can see details of individual charts and more on my StockTwits feed and on chartly.)
If you like what you see above sign up for deeper analysis and trading strategy by using the Get Premium button above. As always you can see details of individual charts and more on my StockTwits page.
The information in this blog post represents my own opinions and does not contain a recommendation for any particular security or investment. I or my affiliates may hold positions or other interests in securities mentioned in the Blog, please see my Disclaimer page for my full disclaimer.
blog comments powered by Disqus
-
 Gregory W. Harmon CMT, CFA, has traded since 1986 and held senior positions including Head of Global Trading, Head of Product Development, Head of Strategy and Director of Equity. (More)
 -
Subscribe to Dragonfly Capital Views
Lifetime Subscription
$4,000.00Sign upAnnual Subscription
$1,000.00Sign upQuarterly Subscription
$350.00Sign up
Recent Posts
- Premium Earnings 10-13-26: Fastenal and Morgan Stanley
- Bull Scan for 10-13-26
- Premium Earnings 10-12-26: Citigroup and Johnson & Johnson
- 4 Trade Ideas Wells Fargo: Bonus Idea
- 5 Trade Ideas for Monday: AbbVie, Airbnb, Affirm, GE Aerospace and Walmart
- Top Trade Ideas for the Week of October 12, 2026: The Rest Premium
- Top Trade Ideas for the Week of October 12, 2026: The Best
- SPY Trends and Influencers October 10, 2026
- Macro Week in Review/Preview October 9, 2026
- Bull Scan for 10-12-26
Archives