Memory Lane: Microsoft, Dell and Hewlett-Packard
- Posted by Greg Harmon
- on February 7th, 2011
What were you doing 10 or 12 years ago? Can you remember? I can, among other duties around trading I was the Y2K coordinator for our group at a Bank in Boston. The world was going to end. Planes were going to fall out of the sky, cars would stop running, bank records were going to be lost forever. Also Dell, Hewlett-Packard, and Microsoft were in their heyday. These stocks hit their highs in 1999 and 2000 and have been dead money since. Dell, the worst, has arguably been in a steady down trend since then. But what brings me down memory lane is that today they are starting to perk up, in a relative sense, and might be good short term trades. Let’s look at some charts.
Dell, Ticker: DELL

Dell, DELL, was in a consolidating range the last quarter of the year, before its recent pullback at the end of January. That pullback found support on the bottom Bollinger band where it printed a long legged doji reversal candle.It has been rising since and at 13.99 looks like it still has move upside. The Moving Average Convergence Divergence (MACD) indicator just turned positive today and has crossed higher. The Relative Strength Index (RSI) is rising and well above the mid line. The price has crossed through the 50, 100 and 200 day Simple Moving Averages (SMA’s). All three of these indicators are bullish. There is resistance from January at 14.41 (3% higher) and then at 14.89 (6.43% higher) from October above that. Not bad for a stock in a 10 year downtrend.
Hewlett-Packard, Ticker:HPQ
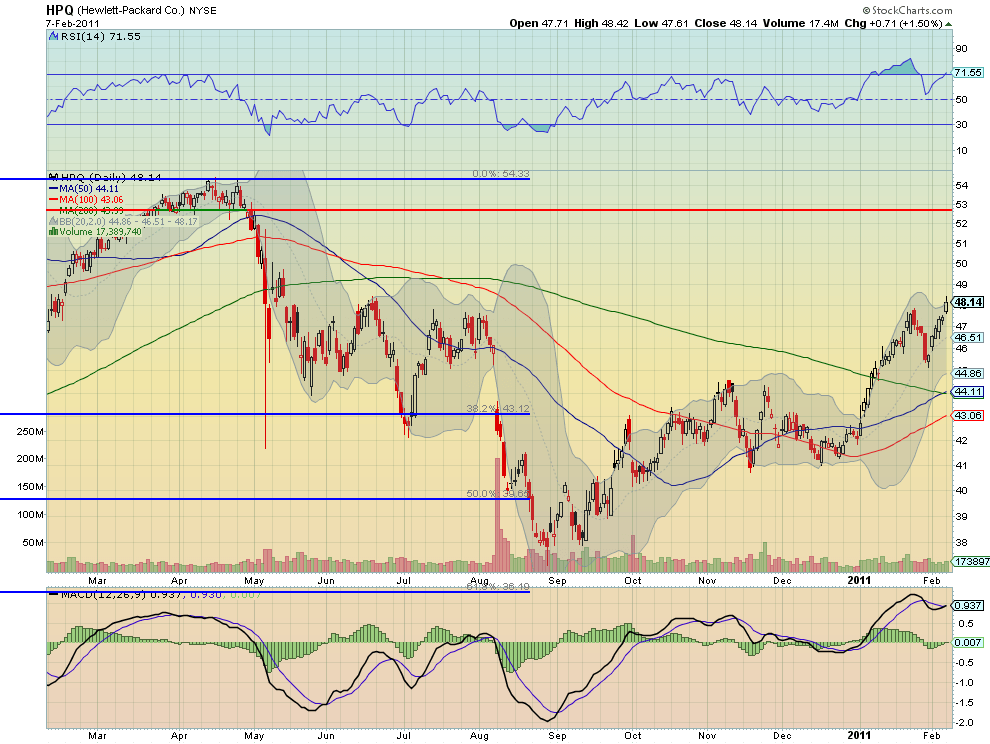
Hewlett-Packard, HPQ, has been moving higher off of a basing period from October through December. After the recent pullback it is heading higher again and looks poised for more upside from several perspectives. First the 50 day SMA has just crossed above the 200 day SMA, the Golden Cross. Next as it reaches the Bollinger band they are no longer contracting but starting to expand higher. Third it has pushed through resistance from June and July today. Finally the MACD is improving and has just crossed up and the RSI is rising but not extreme. HPQ has resistance at 49.60 from May and 50.50 from February before it can retest the 52.70support/resistance line. Additionally looking at the move from 41 to 48 before the pullback and assuming a symmetrical measured move would give a target of 52.
Microsoft, Ticker:MSFT

Microsoft, MSFT, is the least attractive of the group but still has some upside. After consolidating on its 50 day SMA it is now rising and sees resistance first at 28.91 (2.5% higher). If it can clear that level then the next resistance is at 30 and then 31.02 (10% higher). The RSI looks to have bottomed and is now rising which will support a move upward. Also the MACD has started to improve, but looks to be at least a few days away from a cross up.
So don’t ignore the old dinosaurs just because they may be several years away from their all time highs. You just might find a diamond in the rough. Trade’m well.
(As always you can see details of individual charts and more on my StockTwits feed and on chartly.)
If you like what you see above sign up for deeper analysis and trading strategy by using the Get Premium button above. As always you can see details of individual charts and more on my StockTwits page.
The information in this blog post represents my own opinions and does not contain a recommendation for any particular security or investment. I or my affiliates may hold positions or other interests in securities mentioned in the Blog, please see my Disclaimer page for my full disclaimer.
blog comments powered by Disqus
-
 Gregory W. Harmon CMT, CFA, has traded since 1986 and held senior positions including Head of Global Trading, Head of Product Development, Head of Strategy and Director of Equity. (More)
 -
Subscribe to Dragonfly Capital Views
Lifetime Subscription
$4,000.00Sign upAnnual Subscription
$1,000.00Sign upQuarterly Subscription
$350.00Sign up
Recent Posts
- Premium Earnings 10-13-26: Fastenal and Morgan Stanley
- Bull Scan for 10-13-26
- Premium Earnings 10-12-26: Citigroup and Johnson & Johnson
- 4 Trade Ideas Wells Fargo: Bonus Idea
- 5 Trade Ideas for Monday: AbbVie, Airbnb, Affirm, GE Aerospace and Walmart
- Top Trade Ideas for the Week of October 12, 2026: The Rest Premium
- Top Trade Ideas for the Week of October 12, 2026: The Best
- SPY Trends and Influencers October 10, 2026
- Macro Week in Review/Preview October 9, 2026
- Bull Scan for 10-12-26
Archives