Macro Week in Review/Preview January 7, 2011
- Posted by Greg Harmon
- on January 7th, 2011
Last week there was not a Week in Review. Instead a series of longer term in depth analysis on macro market factors, Looking Ahead, replaced it during the Holiday season. The longer view looks positive for Gold but with the short term potential to continue lower, and for Crude Oil to break the flag higher. The US Dollar Index was biased to the upside, while US Treasuries are biased lower. The Shanghai composite looks to rally off of support higher as do emerging markets. Equities in general all appear better to the upside longer term.
The New Year started off strong on many fronts with Gold, Crude Oil, and global equities moving higher. This left just the US Dollar Index and US Treasuries heading lower. But some of the euphoria was short lived as Gold and Oil sold off quickly and the Dollar reversed higher. What can be expected for next week. Let’s look at the charts.
As the week (As always you can see these individual charts and others on my twitter feed and on chartly.)
Gold Daily
Gold Weekly

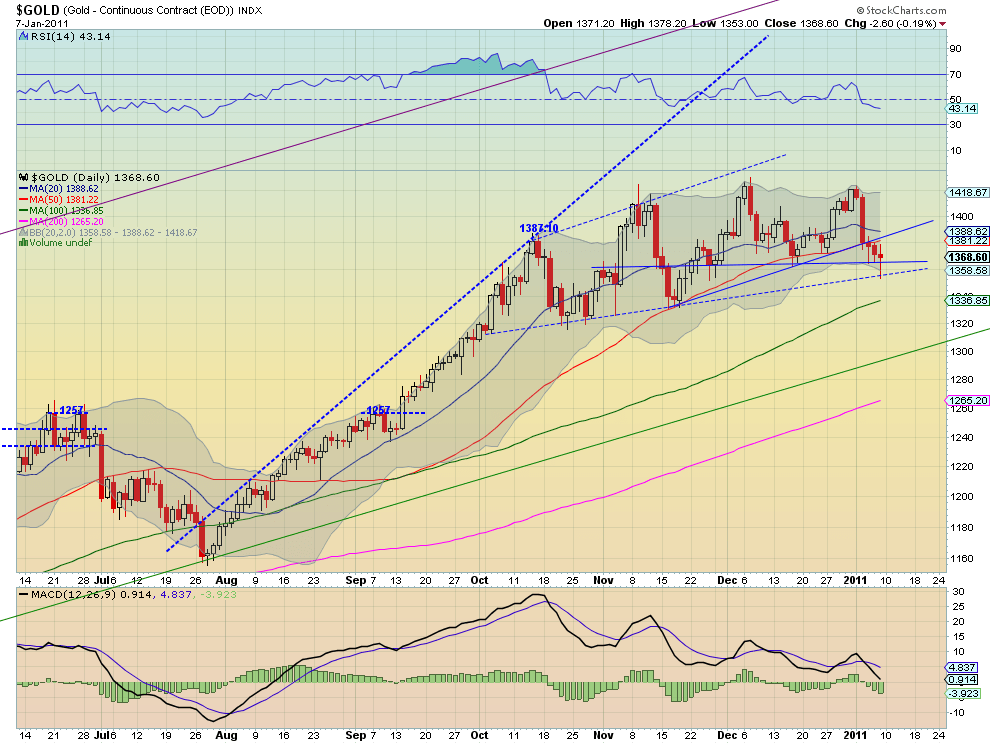
Gold started the New Year opening near the all time highs on Monday, but sold off quickly. The uptrend from mid November on the daily chart could not support it, but it did find support at the 1366 trendline. It is below the 50 day Simple Moving Average (SMA) and the 20 day SMA above that which may now act as resistance. The Relative Strength Index (RSI) falling below the mid line and still pointing down, combined with the worsening in Moving Average Convergence Divergence (MACD) indicator suggest there is more down side coming. The daily chart suggests support might come at the 1356 dotted trend line or the 100 day SMA below that before the green bottom rail of the rising channel. That channel can be seen more easily on the weekly chart in blue. This chart shows the bearish MACD cross as well. If Gold finds support the the upside resistance will come at the 20 day SMA at 1386 and the previous highs before the mid line resistance on the weekly chart at 1441.
West Texas Intermediate Crude Daily
West Texas Intermediate Crude Weekly

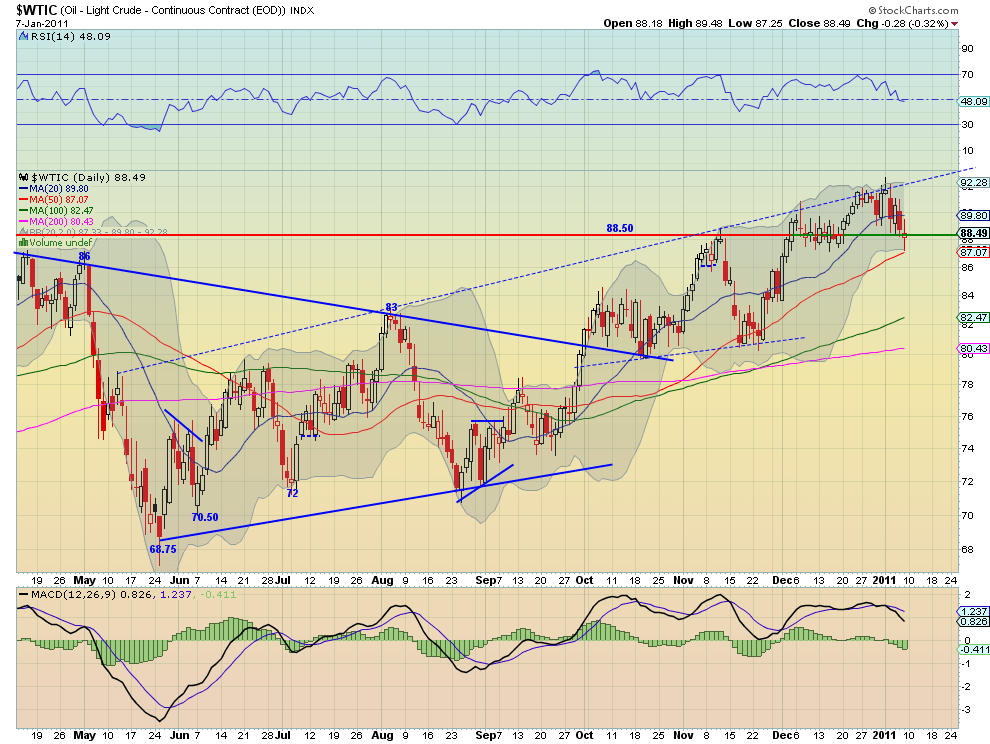
Crude Oil made its highs for the week on Monday as well and fell back throughout the week. The daily charts shows it ending the day Friday with hollow red doji, showing bullish action within the day despite a lower close. The close was right on top of the support/resistance line at 88.50 and the doji aspect suggests some indecision or change coming. It did test support lower of the 50 day SMA and bounced up. The MACD on the daily chart allows for further downside but the RSI is right on the mid-line. The weekly chart with its rising trend on price, the SMA’s and RSI suggest any further pullback will be short lived. Support for a bounce could come at 87 or 84 if 88.50 does not hold. An upside target initially is the rising trend line on the daily chart at 92.25 and then 95 and 100.
US Dollar Index Daily
US Dollar Index Weekly
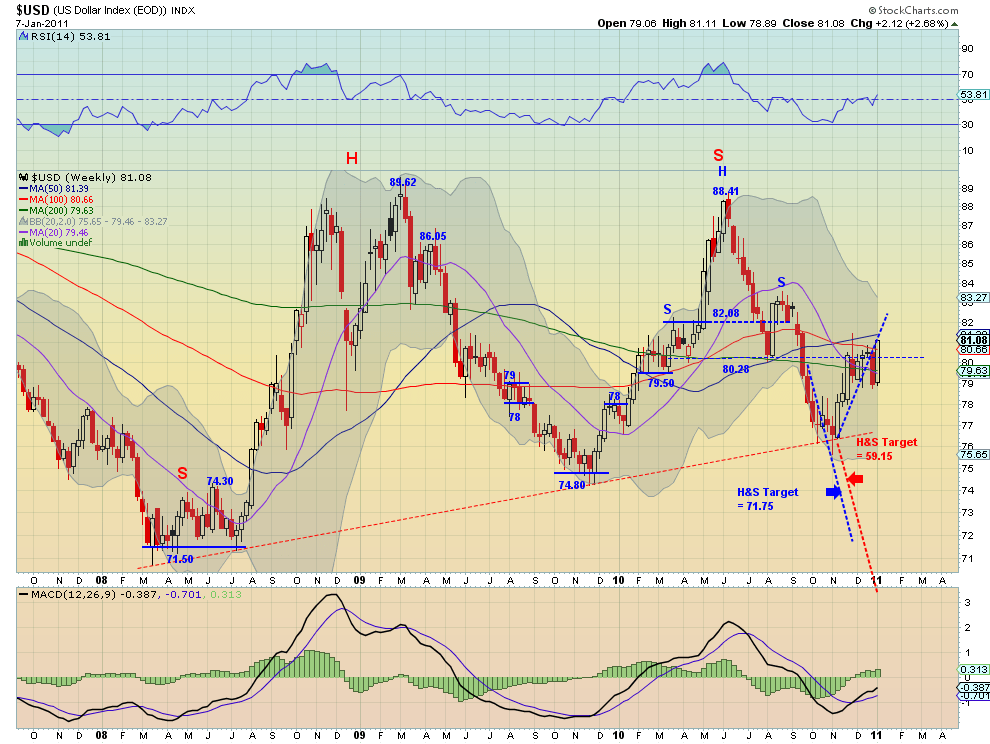
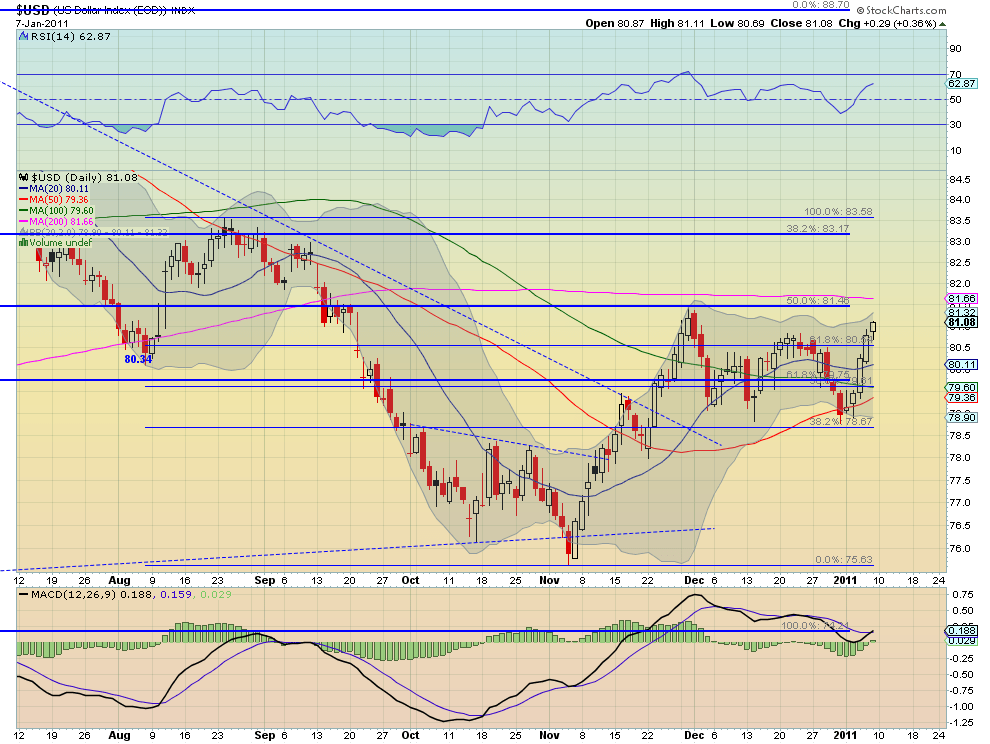
The strong trend higher for the week on the US Dollar Index confirmed the Monday inverted Hammer, and it looks like there is more upside to come. There is resistance higher between 81.39 and 81.66 from the 50% retracement of the upward move from November 2009 to June 2010, the 50 week SMA, the 200 day SMA and the rising trendline on the weekly chart. Both the daily and weekly charts have positive reinforcement from the rising RSI and MACD, supporting a move higher. If it can get through the initial area of resistance the next level is at 82.08. There is support lower at 80.54 and then 80.00-80.28.
iShares Barclays 20+ Yr Treasury Bond Fund Daily
iShares Barclays 20+ Yr Treasury Bond Fund Weekly
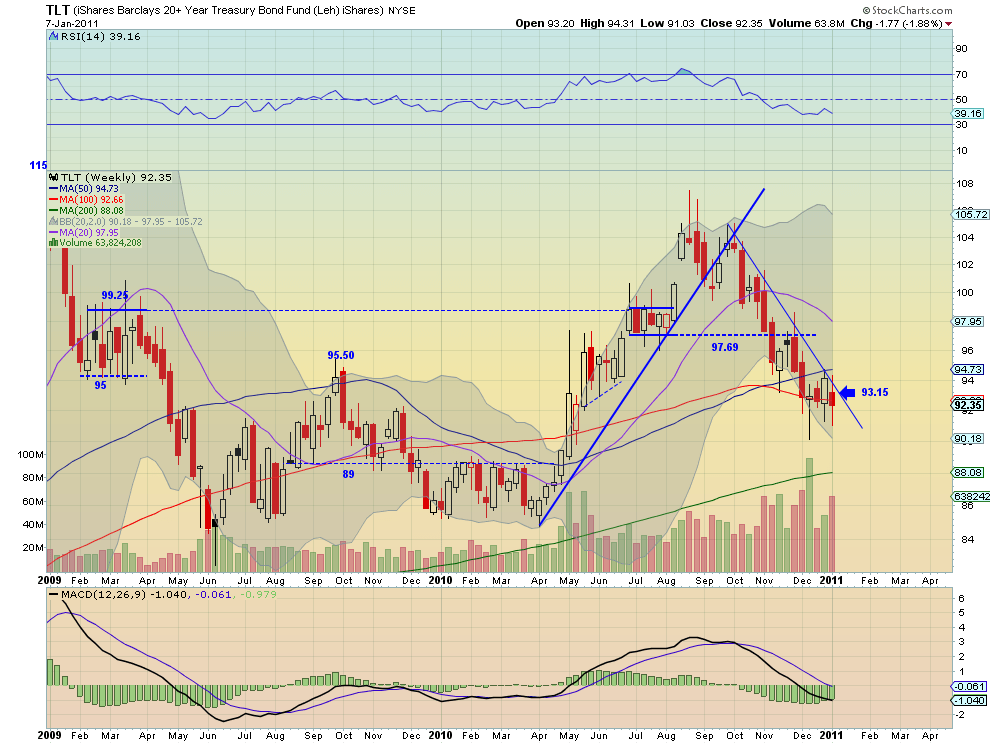
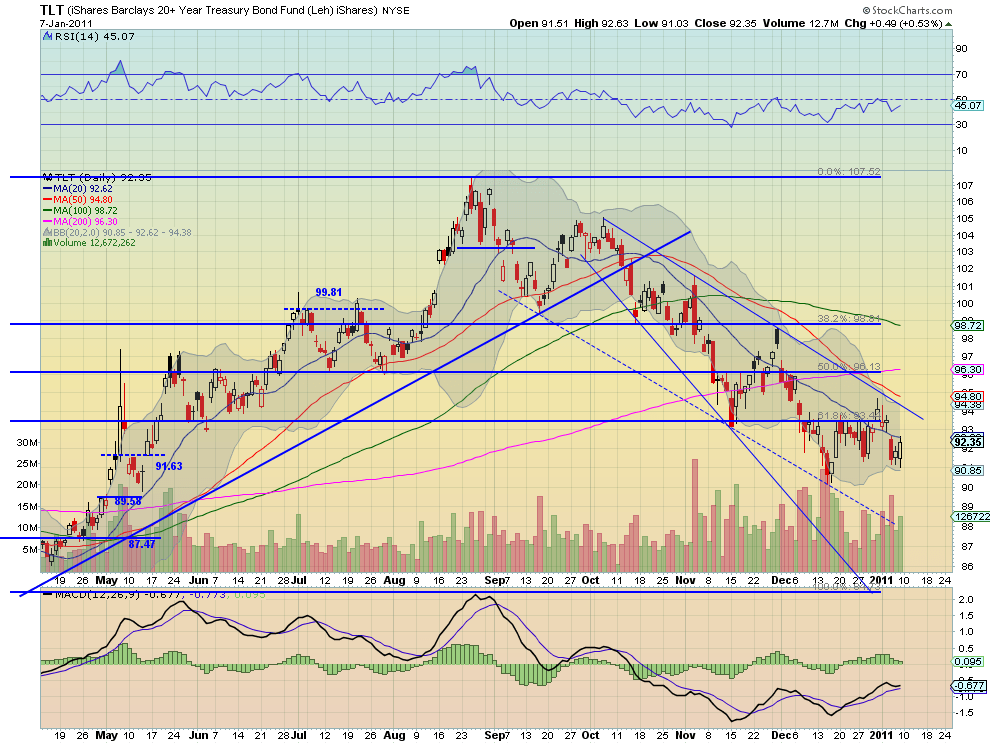
The downtrend in Treasuries can be clearly observed in both the daily and weekly charts, and I expect it to continue. The daily chart shows price being pushed lower by the 20 day SMA within the down channel, but with some recent support around 90. The daily RSI is peaking higher so a move up may occur in the short run, but the MACD looks poised to cross bearishly. The weekly chart shows a broad level of support at the 89 area from early 2010 with the rising 200 week SMA just below, if it falls through the 100 week SMA. Resistance through the down trend channel would come first at 94.80-95.
Shanghai Stock Exchange Composite Daily

Shanghai Stock Exchange Composite Weekly
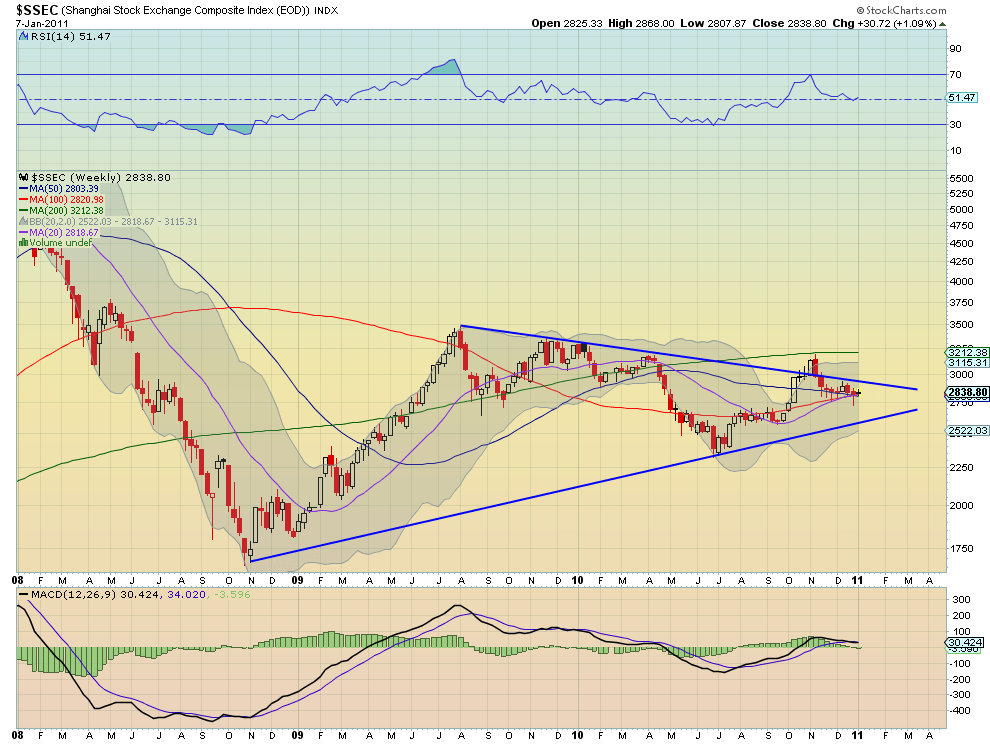
For all of the concern about the Chinese market it has been running sideways between flattening SMA’s as support and resistance for 2 months. There is a broader channel beyond them at 2965 and 2695 lower should it break out of the SMA’s. This does not look to happen next week without a major catalyst.
iShares MSCI Emerging Markets Index Daily

iShares MSCI Emerging Markets Index Weekly
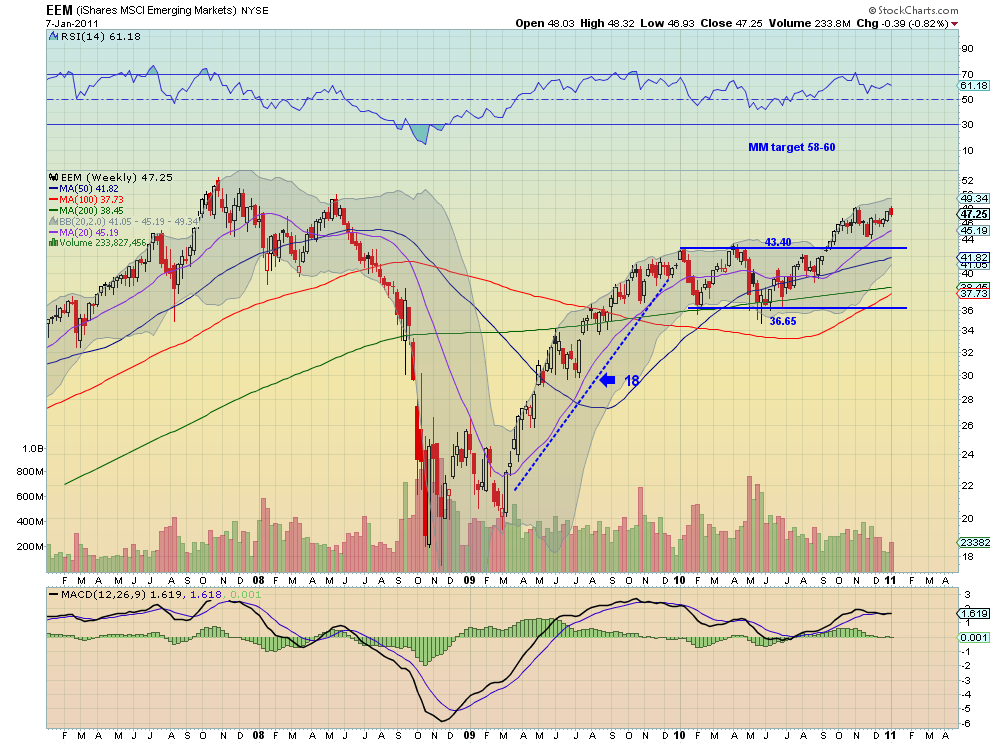
The Emerging Markets are finding some resistance at the highs reached in early November. The run higher was rejected at that level and as it poked outside of the Bollinger bands on the daily chart. If support of the 20 day SMA holds then it can try higher again as the weekly chart suggests it is ready to do. Resistance on the weekly chart will come at 49.35 the high from June 2008 and then 52.35 the high from October 2007, before a chance at the target on a measured move of 58 – 60. If the 20 day SMA does not hold there is additional support at 45 on the daily chart and 43.40, a retest of the channel breakout, on the weekly chart. The falling RSI and MACD on the daily chart suggest a pullback may continue for a short time before it resumes higher, despite the bullish hammer printed on the daily chart Friday.
VIX Daily
VIX Weekly
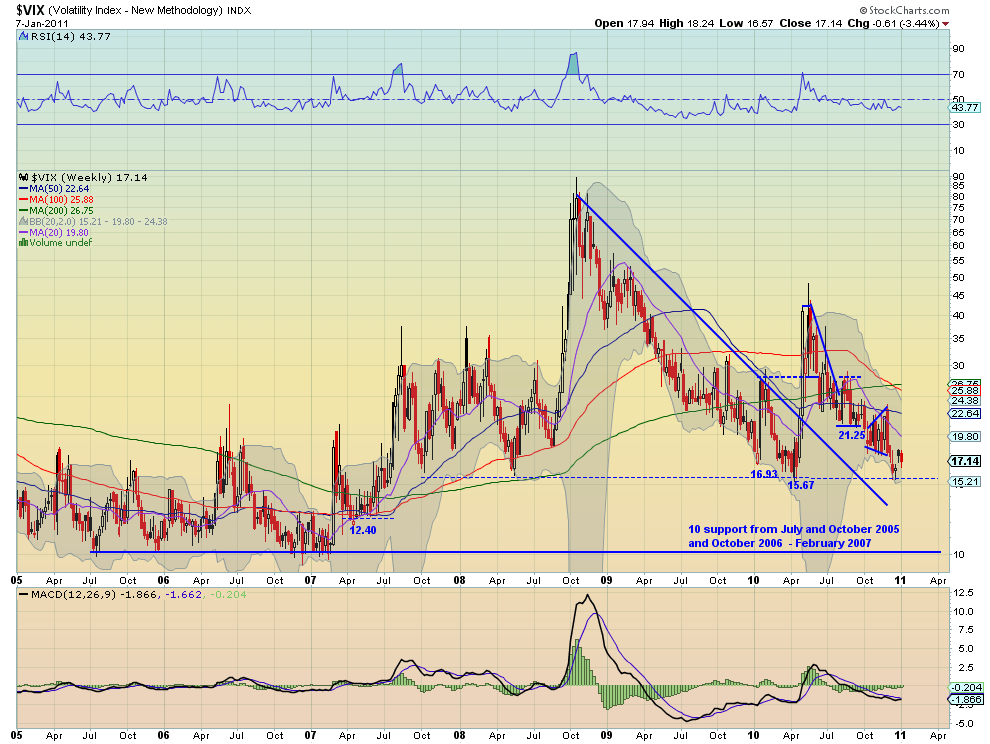
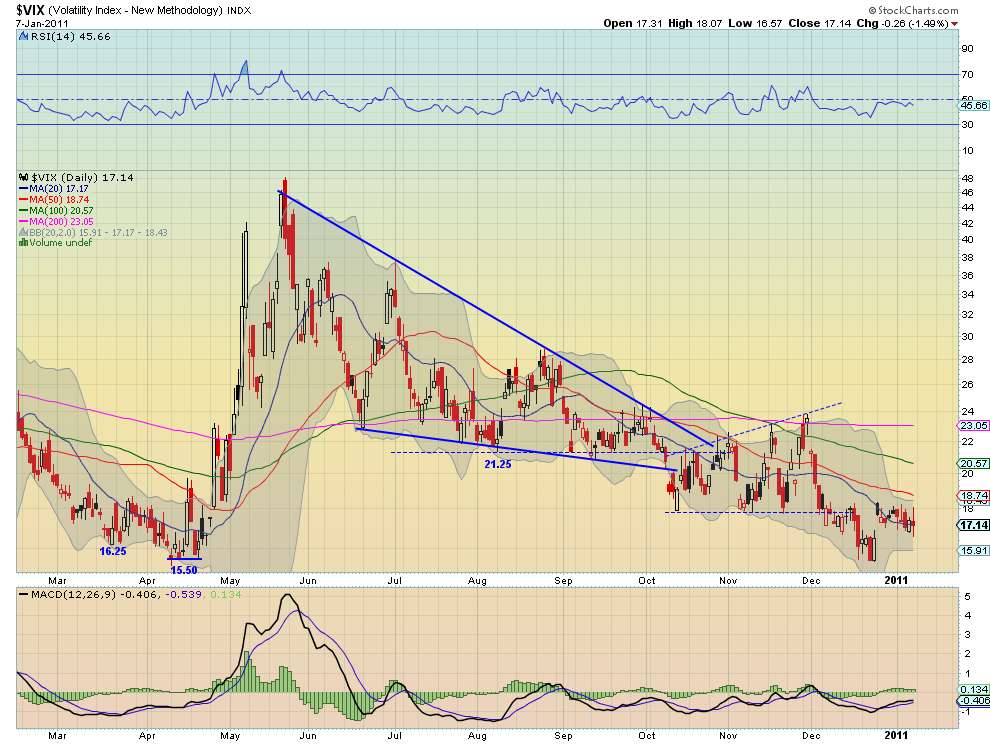
The Volatility Index remained relatively stable and low this week. There is resistance at 18 and then 21.25 higher and support lower at 17 and then 15.50-.67. With all the SMA’s on the daily and weekly pointing lower, as well as the RSI failing to break through the 50 midpoint, expect the VIX to continue to be stable and low.
SPY Daily
SPY Weekly

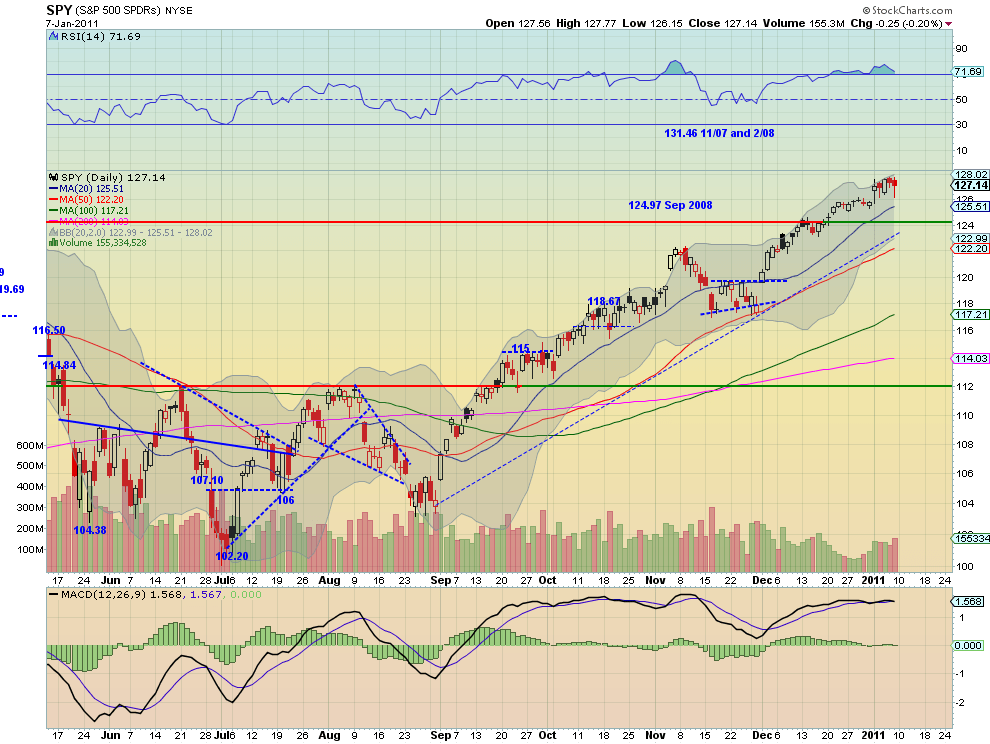
The SPY jumped up on Monday and then bounced against the 128 ceiling the rest of the week, holding Monday’s gains. The daily chart shows it slight into overbought territory on the RSI, but nothing to stop a further run yet. The weekly chart shows the upward trend continuing in a very healthy fashion along the top edge of the Bollinger Bands. All of the SMA’s on both charts are pointing higher and the RSI and MACD on the weekly chart suggest SPY has more upside to come. If it pulls back to work off the overbought RSI on the daily it should be short lived and support can be found at 1224.97, the April highs.
IWM Daily
IWM Weekly
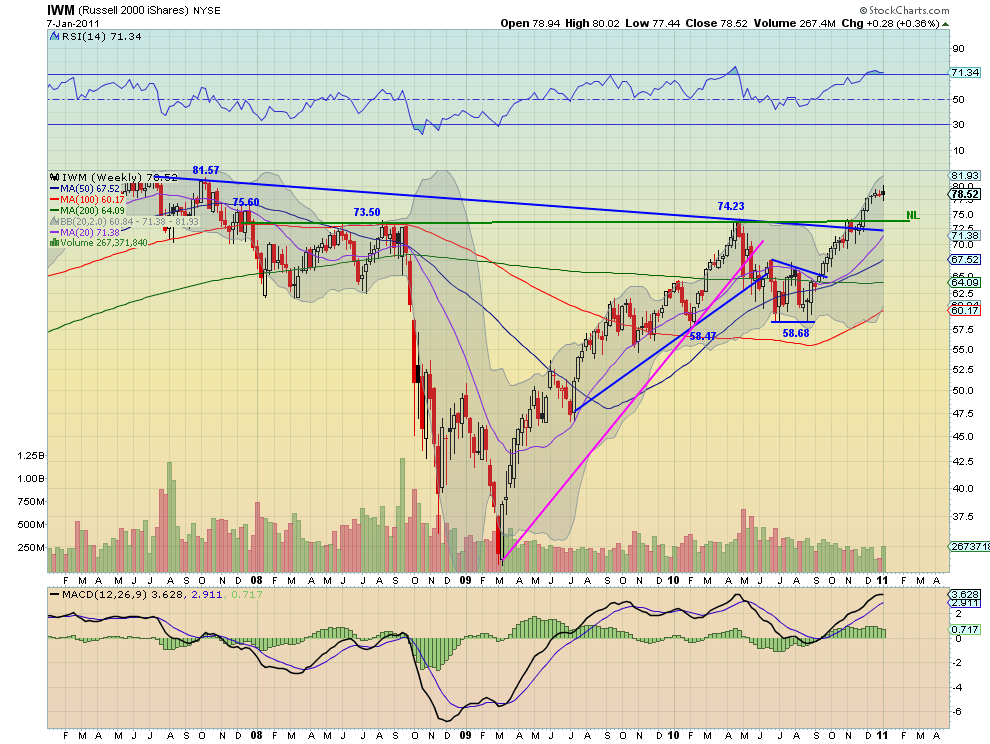
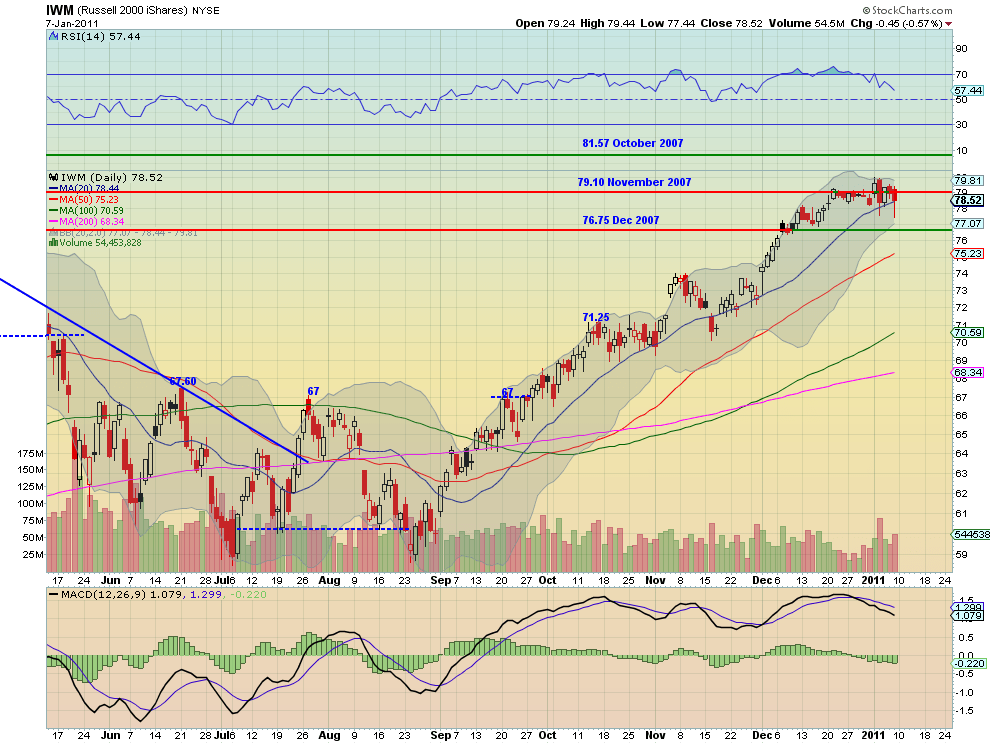
IWM has been consolidating near the November 2007 high of 79.10 on the daily chart since mid-December. The trend is still up but the widening of the range during the last week combined with the falling RSI suggests that there may be a pullback. If so then support can be found at 76.75-77 on the daily chart and the neckline of the inverted head and shoulders near 75 on the weekly chart. The weekly chart shows consolidation beginning with the RSI leveling. Not bearish but also not the strong bull move it had been in for the last 5 weeks. I suggest cautious optimism in the medium term for IWM and be prepared for a short term pullback.
QQQQ Daily
QQQQ Weekly

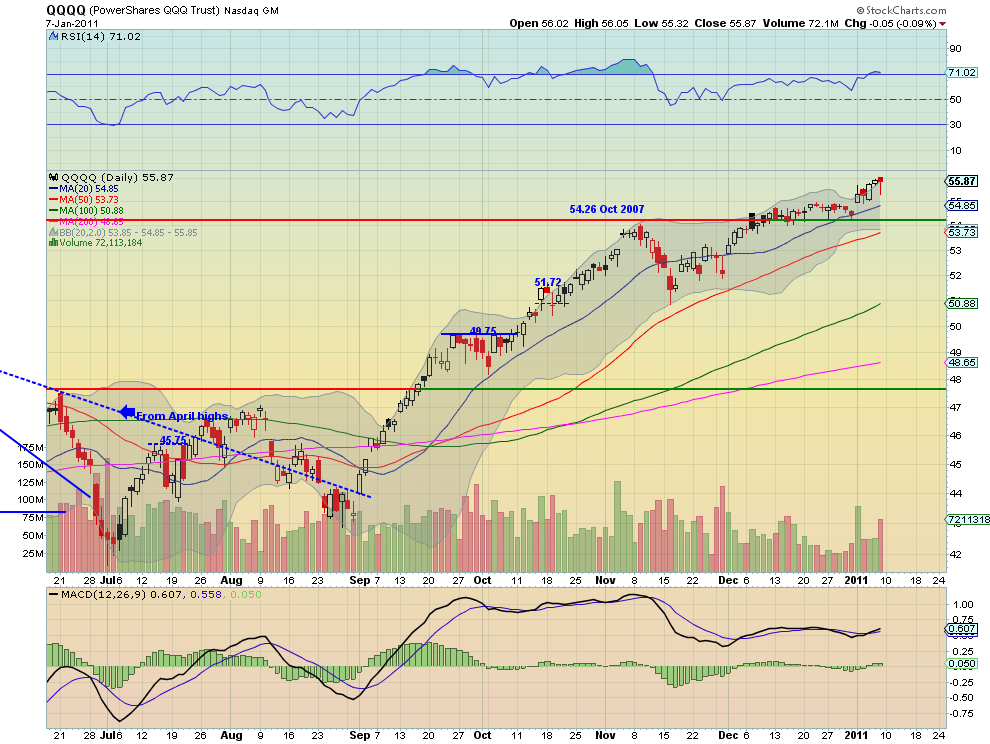
The QQQQ drove higher Monday and then continued higher throughout the week, with a bit of a hiccup Friday. But all the SMA’s are pointing higher and the MACD is improving with a flat but high RSI all on the daily chart. Moving to the weekly chart QQQQ broke out of the consolidation it had been going through the last 4 weeks and now is continuing the trend higher. In fact this week’s white candle is the longest since the last thrust higher 5 weeks ago, almost a Marubozu (no shadows or wicks – a very powerful move). The Hanging Man candle on the daily chart Friday may indicate a pullback, but i would expect it to be small given the very bullish nature of the weekly chart, perhaps to the 54.00-54.26 area.
So next week looks like more pain for long holders of Gold and Treasuries, but brighter for the US Dollar index and Crude Oil. Emerging markets look better higher with perhaps a slight pullback. The Chinese market nor the Volatility Index do not look to play a factor in influencing the US markets. SPY and QQQQ look like the best of the US market Indexes, with strong bullish charts where as the IWM may need to pullback some before it can join them higher.
Trade’m well.
If you like what you see above sign up for deeper analysis and trading strategy by using the Get Premium button above. As always you can see details of individual charts and more on my StockTwits page.
The information in this blog post represents my own opinions and does not contain a recommendation for any particular security or investment. I or my affiliates may hold positions or other interests in securities mentioned in the Blog, please see my Disclaimer page for my full disclaimer.
blog comments powered by Disqus
-
 Gregory W. Harmon CMT, CFA, has traded since 1986 and held senior positions including Head of Global Trading, Head of Product Development, Head of Strategy and Director of Equity. (More)
 -
Subscribe to Dragonfly Capital Views
Lifetime Subscription
$4,000.00Sign upAnnual Subscription
$1,000.00Sign upQuarterly Subscription
$350.00Sign up
Recent Posts
- Bull Scan for 10-14-26
- Premium Earnings 10-13-26: Fastenal and Morgan Stanley
- Bull Scan for 10-13-26
- Premium Earnings 10-12-26: Citigroup and Johnson & Johnson
- 4 Trade Ideas Wells Fargo: Bonus Idea
- 5 Trade Ideas for Monday: AbbVie, Airbnb, Affirm, GE Aerospace and Walmart
- Top Trade Ideas for the Week of October 12, 2026: The Rest Premium
- Top Trade Ideas for the Week of October 12, 2026: The Best
- SPY Trends and Influencers October 10, 2026
- Macro Week in Review/Preview October 9, 2026
Archives