Macro Week in Review/Preview January 21, 2011
- Posted by Greg Harmon
- on January 21st, 2011
Last week’s review of the macro market indicators looked to bring lower prices still for Gold but the bleeding could end soon with support nearby, and higher prices for Crude Oil. Treasuries looked to resume their walk lower and the US Dollar Index to find support shortly and then move back higher. The Shanghai Composite looked to head lower but with the other Emerging market poised to move up. The low Volatility Index did not look to rise materially any time soon facilitating a further rise in the equity index ETF’s.
Gold hung tough early but gave it up big time into the end of the week as did Crude Oil, testing support. Treasuries have continued lower but not to new lows yet and the US Dollar Index is still looking for that support. Shanghai did sell off and the EEM is following it lower. SPY has held up while IWM and QQQQ have cracked a bit and fallen lower. What does all this mean for next week. Let’s look at some charts.
(As always you can see these individual charts and more on my StockTwits feed and on chartly.)
Gold Daily
Gold Weekly

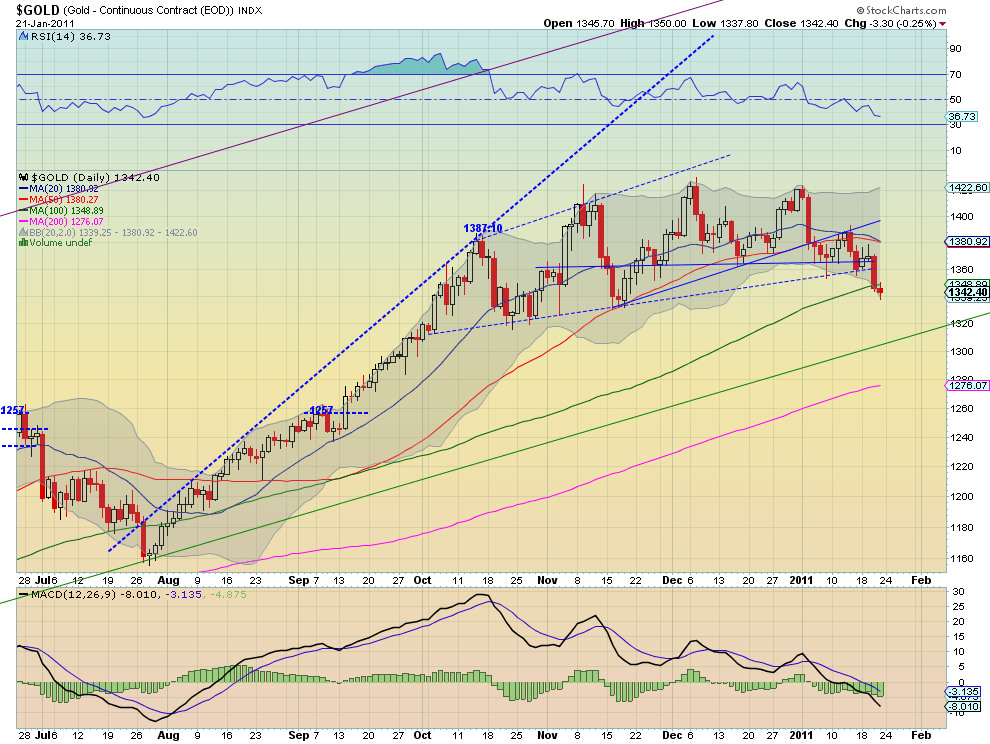
Gold continued to pullback this week and it looks to continue next week as well. The daily chart shows the Relative Strength Index (RSI) heading to the oversold level but with some room to go still. It lost the support of the 100 day Simple Moving Average (SMA) and has previous support at about 1325 and then the long uptrend below. Also note that the shorter SMA’s are rolling lower. The weekly chart puts the pullback in perspective. Gold can still fall to 1328 before breaking the 2 year uptrend channel. It does look to test that trendline and if it does this week the RSI will likely be at 50 on the weekly chart. A break of the trend line sees support at the 200 day SMA at 1276 and then 1250 – 1255 where previous support held on the weekly chart and the 50 week SMA.
West Texas Intermediate Crude Daily
West Texas Intermediate Crude Weekly
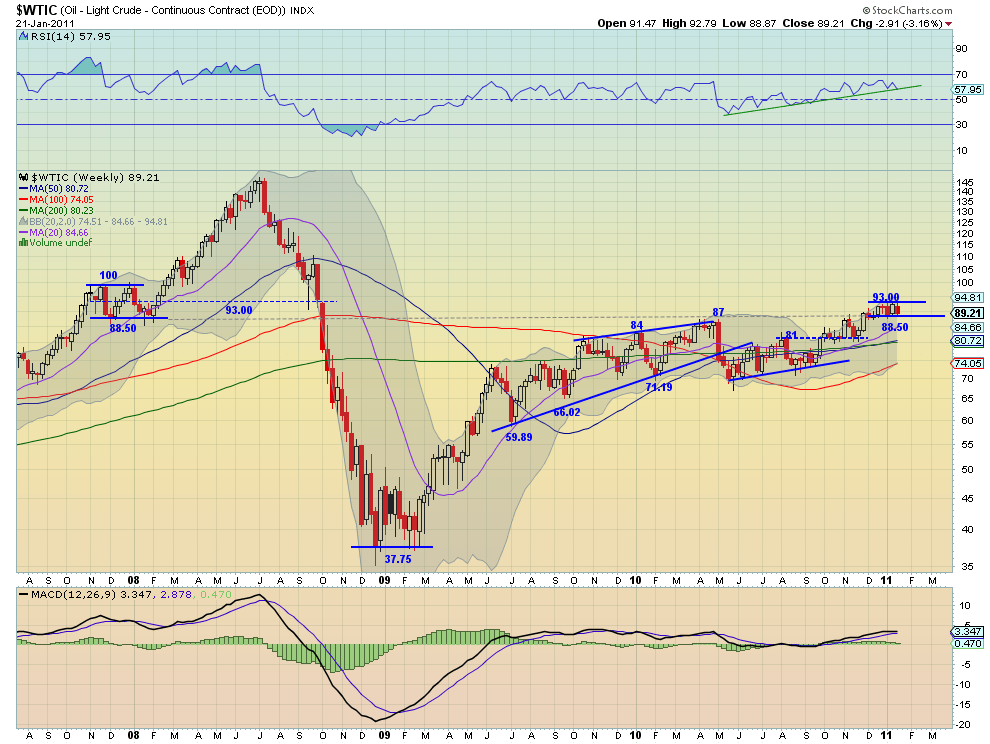
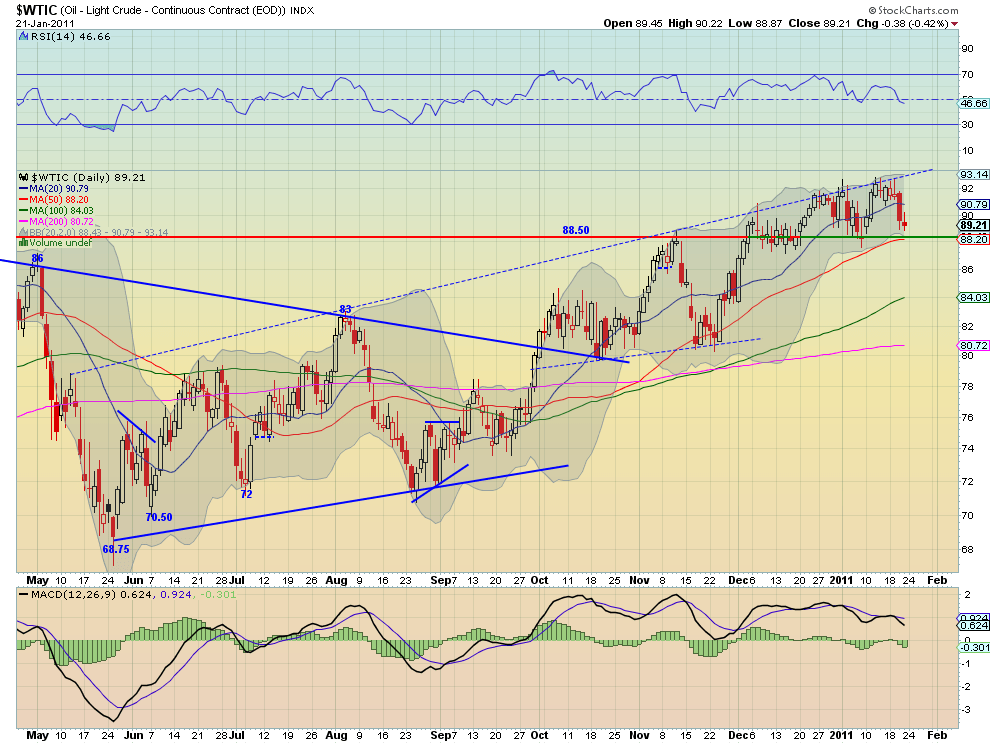
Crude Oil proved it hard to crack the rising trend line again this week on the daily chart and eventually pulled back just above support at the 88.50 area. The RSI is still looking lower and the Moving Average Convergence Divergence (MACD) indicator is becoming more negative, suggesting more downside and another test of the 88.50 level. The weekly chart is much more bullish showing a consolidation in a bull flag after the move higher with support at 88.50 and resistance at 93. The RSI is trending higher. Also all of the SMA’s are pointing higher. This suggests that 88.50 support may hold and Crude may try to move higher again. the resistance above the flag is at 100 and below it at 87.
US Dollar Index Daily

US Dollar Index Weekly
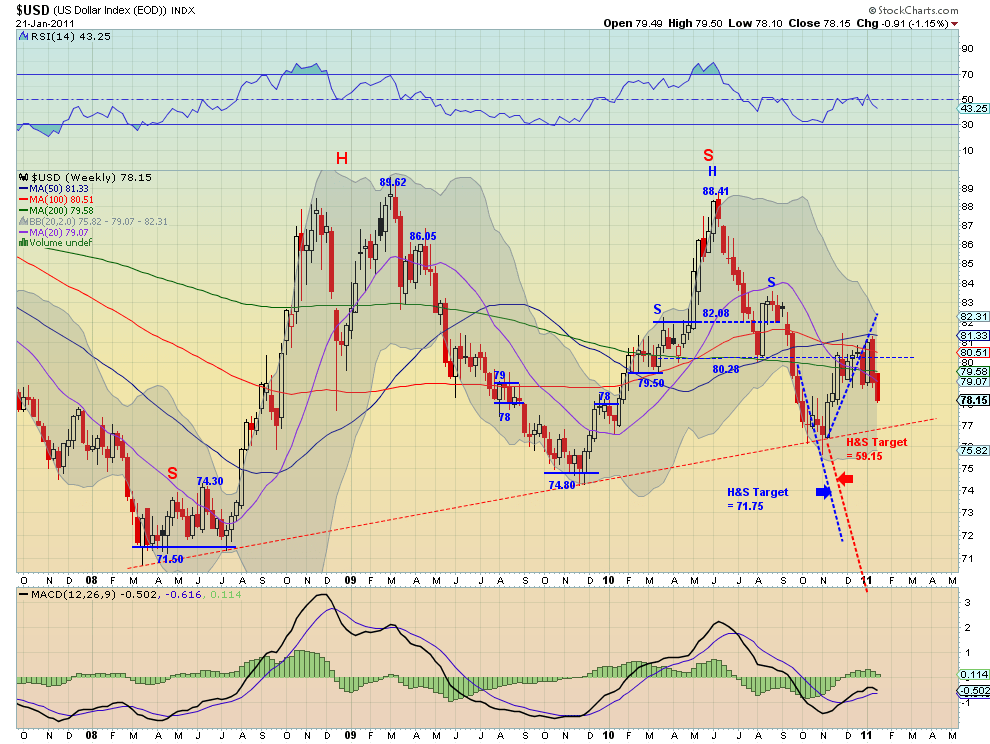
The US Dollar Index continued its down move but fell below the channel it has been in, between 81.40 and 78.65, since late November. The strong move down today coupled with the falling but not yet oversold RSI and the increasingly negative MACD suggest next week will bring more of the same. Additionally the 20 day SMA just crossed the 50 day SMA heading lower. From the weekly chart the Index moved lower this week after losing support of both the 100 week and 200 week SMA’s. The MACD on the weekly chart is also about to cross lower. There is some support at 78 but below that the next level of support is at 77 a full point lower, and then 75.60 on the daily chart and 74.80 from the weekly chart.
iShares Barclays 20+ Yr Treasury Bond Fund Daily
iShares Barclays 20+ Yr Treasury Bond Fund Weekly

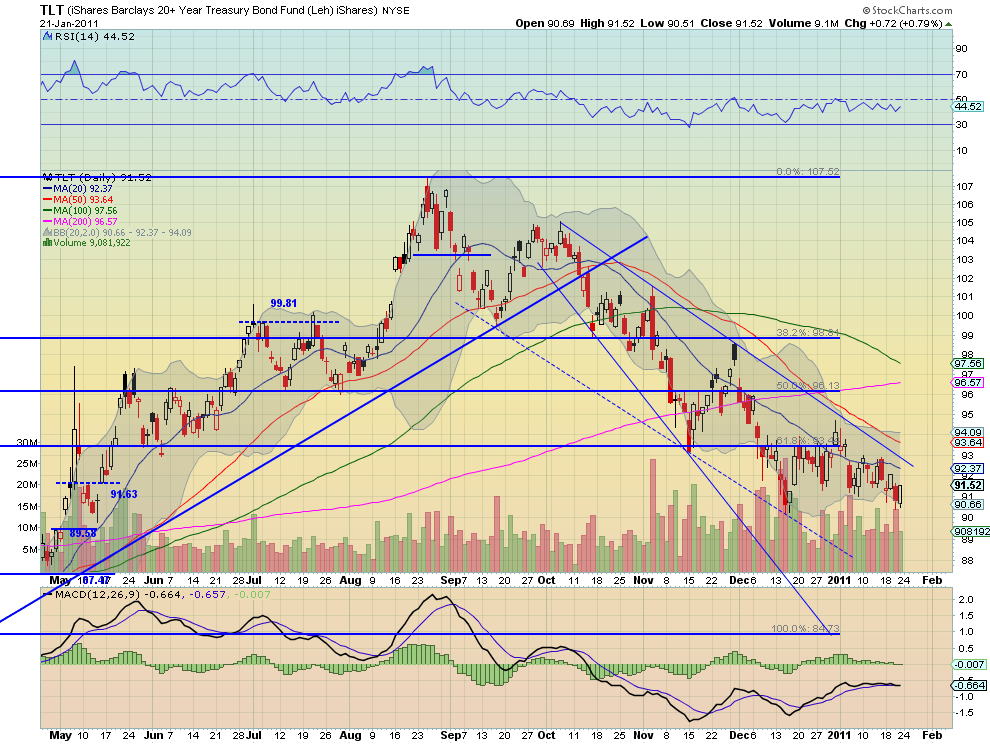
TLT, the US Treasury ETF, remains in a downtrend on both the daily and weekly chart. The sideways consolidation on the daily chart is testing the support of the low end near 90.25, and 3 of the 4 SMA’s have rolled south now. The weekly chart shows the price hugging the resistance of the trendline. Although the candle on the weekly was bullish, a hollow red candle, look for the downtrend to continue until and unless the price breaks the trendline and the 100 week SMA at 92.50 – 92.75. The next support comes at 988.60 below the current lows of 90.25.
Shanghai Stock Exchange Composite Daily
Shanghai Stock Exchange Composite Weekly
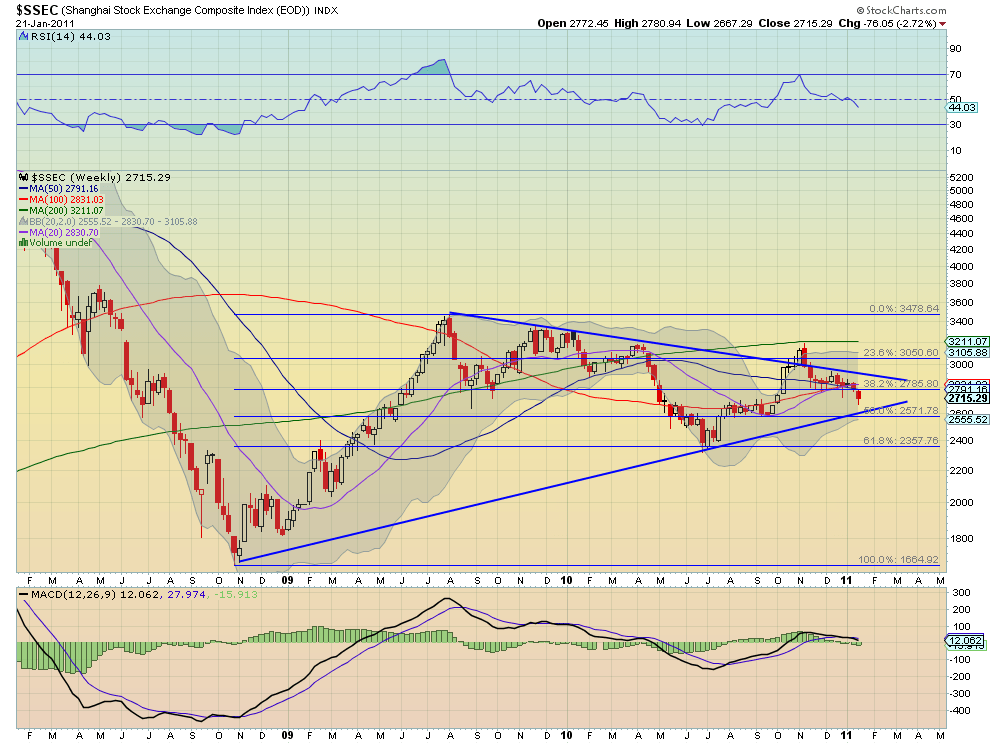
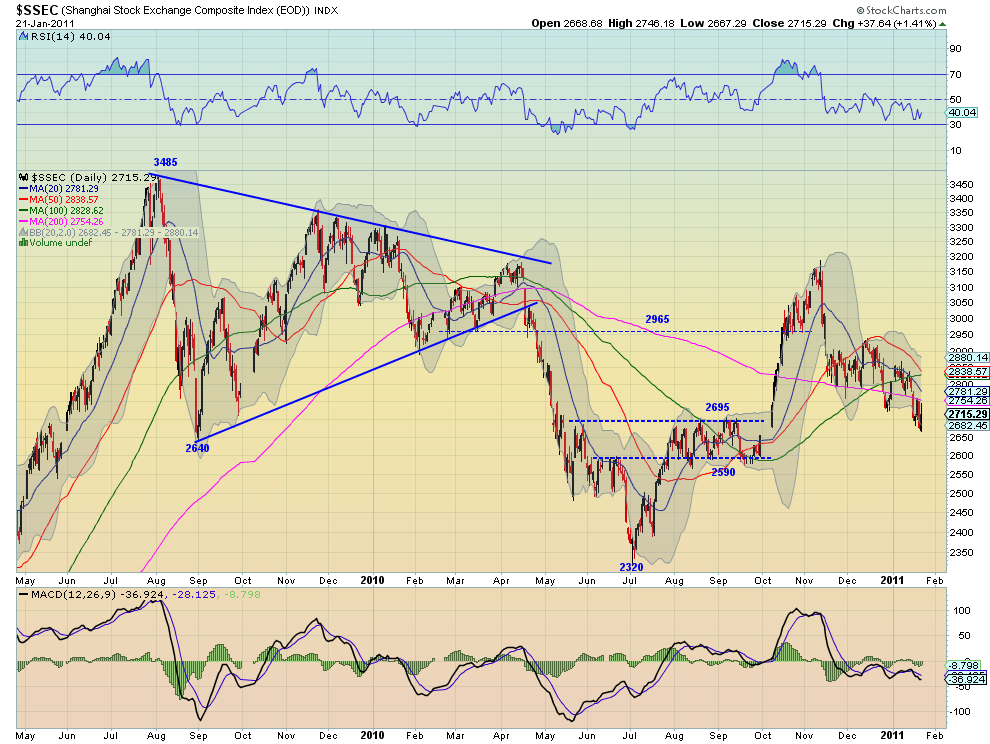
The Chinese market is being pushed lower by the shorter SMA’s, the 20 day and 50 day, on the daily chart. It also seems that the 200 day SMA is acting as resistance this past week. The Composite is now back in the consolidation range between 2590 and 2695 from the Summer. The weekly chart shows that it is heading to a test of support of the lower trendline near 2925 and the possibly a 50% retracement of the up move at 2571. The RSI on both charts support a continued move lower.
iShares MSCI Emerging Markets Index Daily
iShares MSCI Emerging Markets Index Weekly
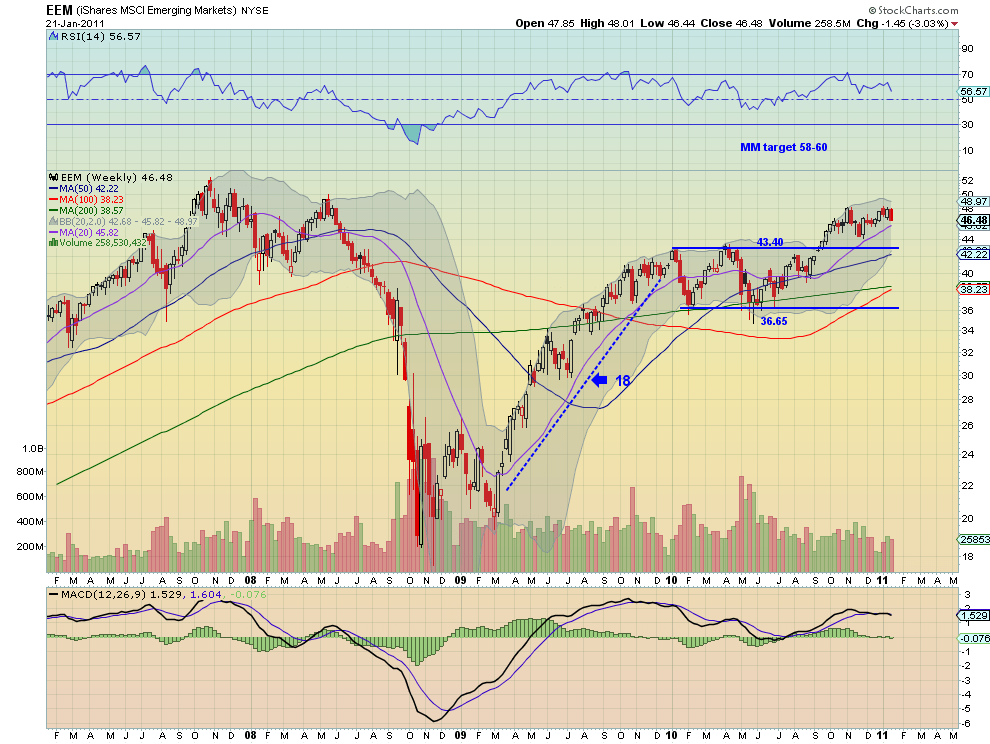
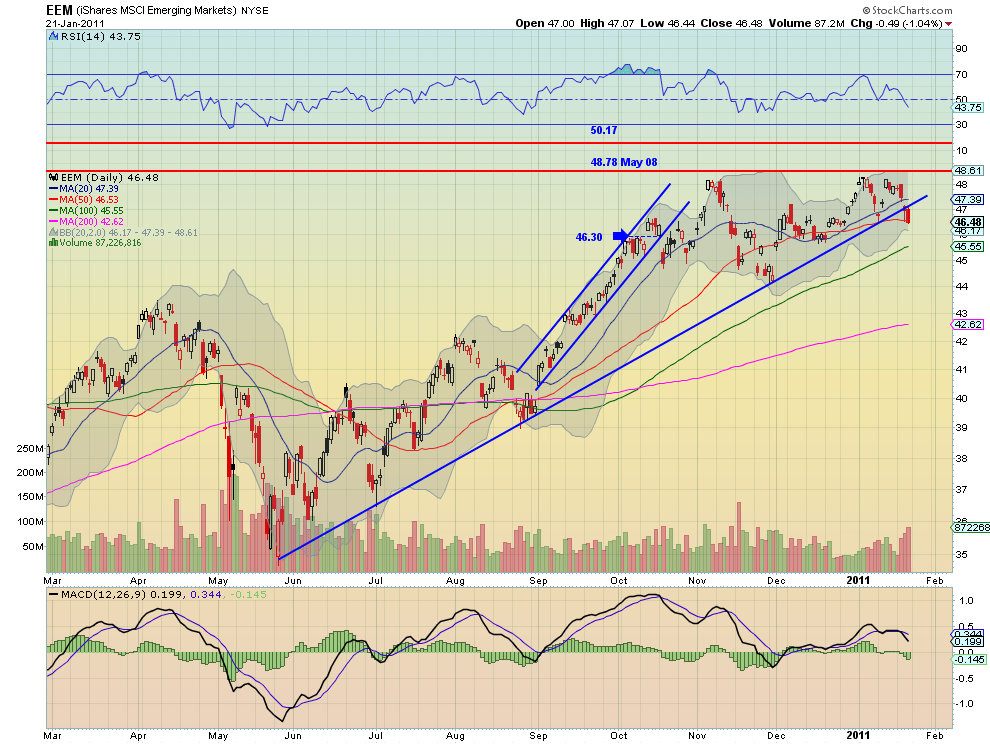
The daily chart of the Emerging market ETF, EEM, broke through its rising trendline lower on Friday and found support near the 50 day SMA. But the relative length of the red candle and the shortness of the shadows is very bearish going forward. The MACD and RSI on the daily chart point to more downside as well. The 100 day SMA at 45.55 or the December low of 44.16 would be natural places to find support. The weekly chart printed a bearish engulfing candle with a falling RSI and a MACD cross. All signs point lower with support at the 20 week SMA at 45.82 or a retest of the channel breakout at 43.40.
VIX Daily

VIX Weekly
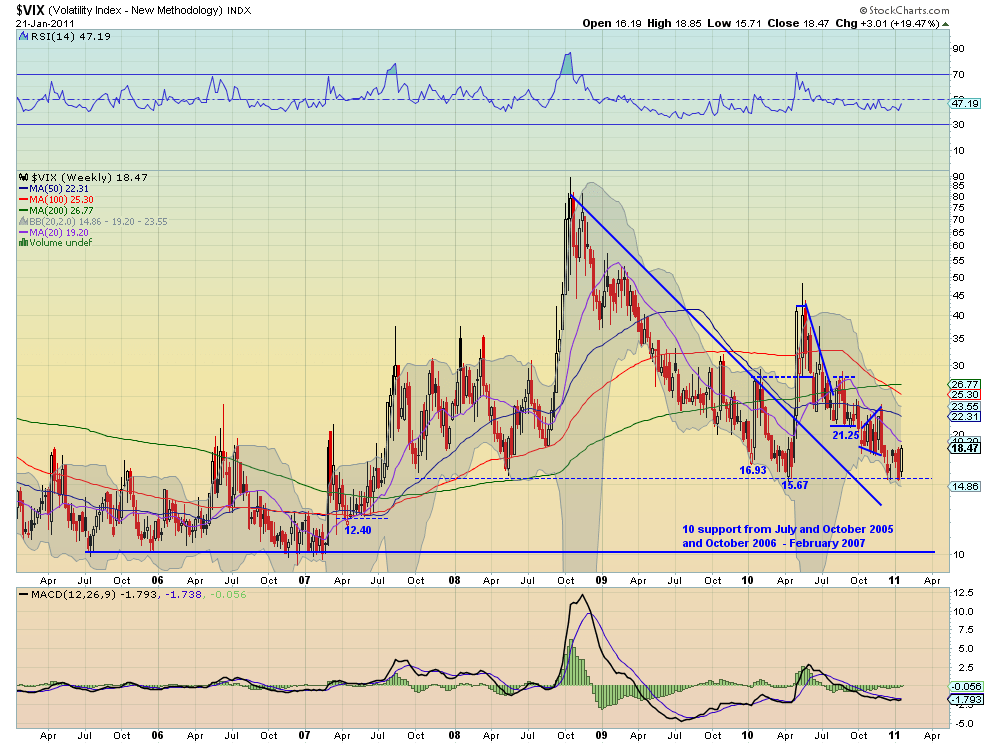
The Volatility Index bounced off of the longtime support level of 15.50 this week, but finished a few points higher. The 18.50 level has been both support and resistance lately with 21.25 above that. There are currently no signs of an imminent out-sized move so expect at range between 21.25 and 15.50 for the near term.
SPY Daily
SPY Weekly

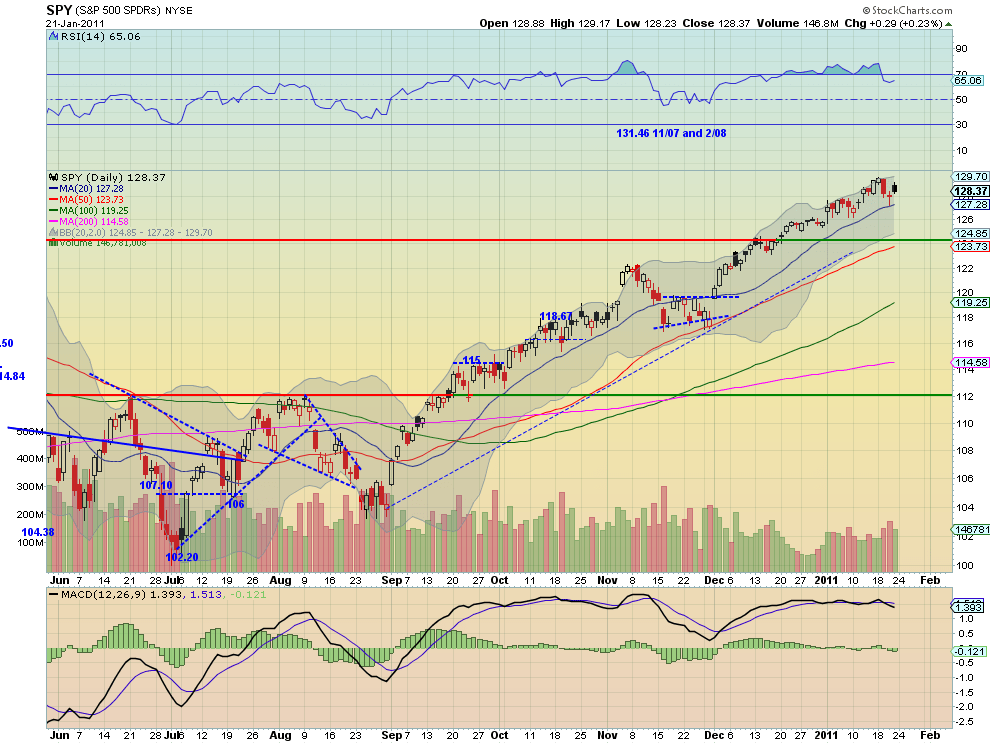
The SPY had a decent week, falling back to the 20 day SMA and finding support before moving back higher Friday. This pullback worked off the overbought condition on the RSI as well. The trend continues to be higher as noted by the rising SMA’s. The weekly chart shows the current trend unbroken in the middle of a rising channel. The next resistance higher comes at 131.46 and expect it to head toward that level.
IWM Daily
IWM Weekly
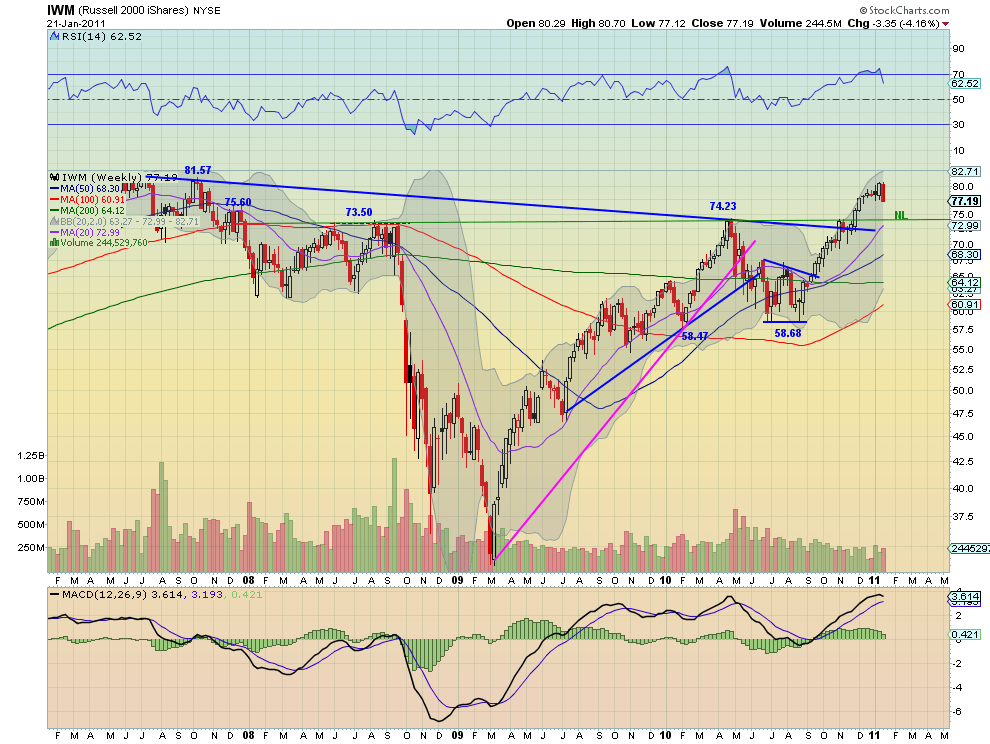
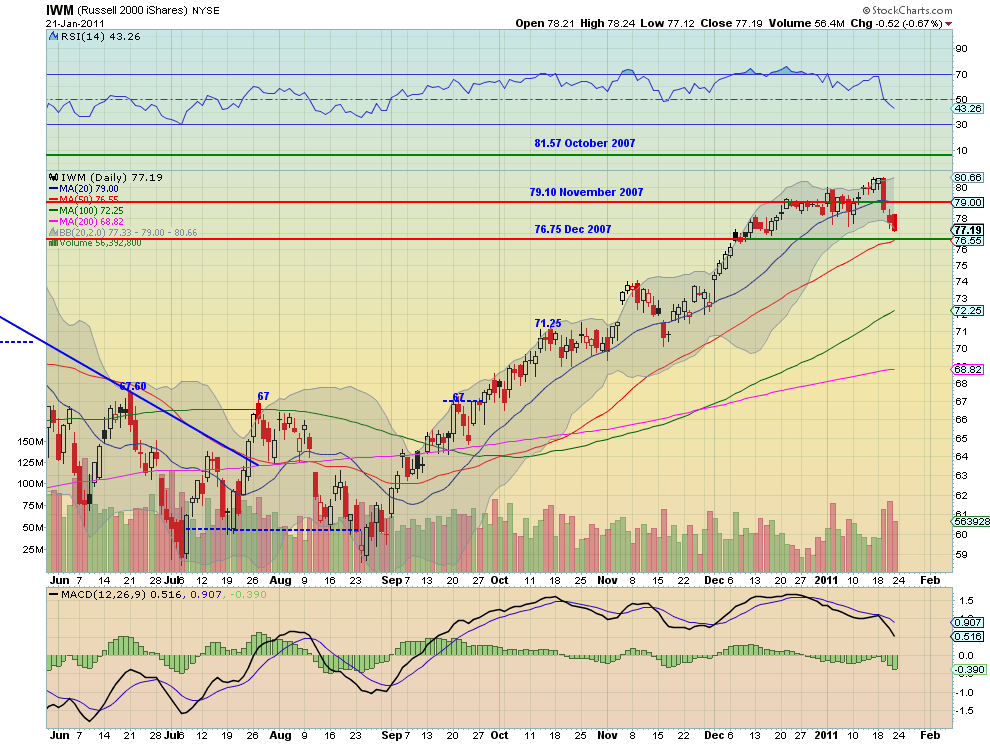
The IWM on the other hand did not have a good week. A small consolidation day followed by 3 down days leaves it just above the December 2007 support of 76.75 on the daily chart. The RSI has dipped below the mid line and the MACD is becoming more negative. The lone bright spot, if you can call it that, is that the price pierced the Bollinger band to the downside, which should give it some support. On the weekly chart this resulted in a bearish engulfing candle. The RSI and MACD on the weekly are also suggesting lower prices with the MACD about to cross lower as well. From the weekly chart there is additional support near the neckline and quadruple top at about 74.35. Look for more downside.
QQQQ Daily
QQQQ Weekly
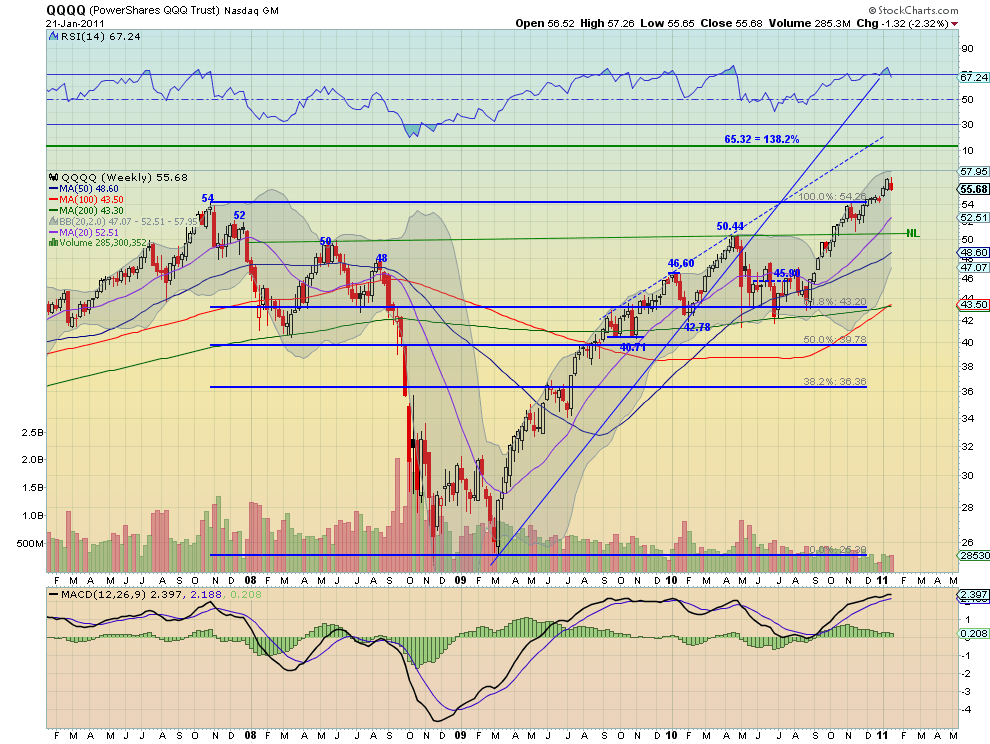
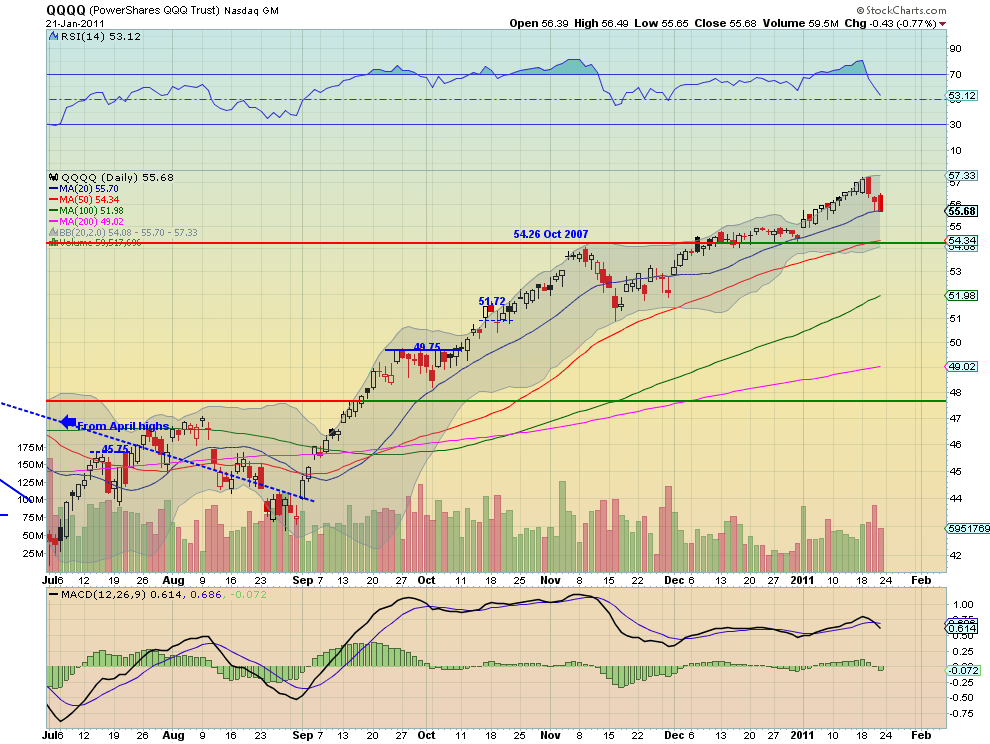
The QQQQ was in between the other two ETF’s. The daily chart looks weak with three consecutive down days and now near support of the 20 day SMA at 55.70. There is additional support at 55 and then the October 2007 highs of 54.26. It may need that support as the MACD crossed lower Thursday and the RSI is still falling, adding to the bearish case. But the weekly chart is not so bleak. The inside red candle does nothing to question the uptrend and actually helps work off the slightly overbought condition on the RSI. Prepare for the possibility of a further pullback in the short run but to for the longer term uptrend to remain in tact.
So next week looks to continue the bloodbath for Gold the US Dollar Index and US Treasuries. Although Crude Oil looks to be heading lower there is a lot of support nearby. The Shanghai Composite and Emerging markets look headed lower too. The divergence in the US equity Indexes, with the large cap SPY doing better than the QQQQ which is doing better than the IWM also looks to continue, with the SPY looking higher, the QQQQ mixed and the IWM looking lower. Good luck next week and trade’m well.
If you like what you see above sign up for deeper analysis and trading strategy by using the Get Premium button above. As always you can see details of individual charts and more on my StockTwits page.
The information in this blog post represents my own opinions and does not contain a recommendation for any particular security or investment. I or my affiliates may hold positions or other interests in securities mentioned in the Blog, please see my Disclaimer page for my full disclaimer.
blog comments powered by Disqus
-
 Gregory W. Harmon CMT, CFA, has traded since 1986 and held senior positions including Head of Global Trading, Head of Product Development, Head of Strategy and Director of Equity. (More)
 -
Subscribe to Dragonfly Capital Views
Lifetime Subscription
$4,000.00Sign upAnnual Subscription
$1,000.00Sign upQuarterly Subscription
$350.00Sign up
Recent Posts
- Premium Earnings 10-13-26: Fastenal and Morgan Stanley
- Bull Scan for 10-13-26
- Premium Earnings 10-12-26: Citigroup and Johnson & Johnson
- 4 Trade Ideas Wells Fargo: Bonus Idea
- 5 Trade Ideas for Monday: AbbVie, Airbnb, Affirm, GE Aerospace and Walmart
- Top Trade Ideas for the Week of October 12, 2026: The Rest Premium
- Top Trade Ideas for the Week of October 12, 2026: The Best
- SPY Trends and Influencers October 10, 2026
- Macro Week in Review/Preview October 9, 2026
- Bull Scan for 10-12-26
Archives