Macro Week in Review/Preview December 23, 2010
- Posted by Greg Harmon
- on December 23rd, 2010
Last week’s review of the macro market indicators looked positive for Gold but with the short term potential to continue lower, and for Crude Oil to break the flag higher. The US Dollar Index was biased to the upside with a short term potential lower from the Hanging Man, while US Treasuries are biased lower, although have a little room higher before the turn. The Shanghai composite looked to rally off of support higher but emerging markets looked to meander higher. Volatility was headed lower still but has little room before strong support. Equities looked to be flat to a small pullback short term but all appear better to the upside longer term.
As the week began Gold did rise and then stabilized with Crude Oil moving up. The US Dollar Index was creeping up and Treasuries hovered. Equities also crept higher, barely, early but broke higher mid week. What does next week bring? Let’s look at the charts.
(As always you can see these individual charts and more on my twitter feed and on chartly.)
Gold Daily

Gold Weekly

Gold has consolidated sideways for the past week between the 50 day Simple Moving Average (SMA) and the 20 day SMA. Both SMA’s are flattening out on a daily chart. With the Relative Strength Index (RSI) flat and the Moving Average Convergence Divergence (MACD) indicator holding slightly negative, Gold looks to continue sideways or slightly down in the short run. The tightening Bollinger bands say it could be very soon. There is support under the 50 day SMA at 1360 and then the trendline near 1345 on the daily chart. The weekly chart shows the uptrending channel continues with support at 1370 holding this week. The Mid line above acts as resistance at 1420. The MACD cross suggests that a further pullback may be coming, and if so then there is additional supp at 1325 to 1330 area.
West Texas Intermediate Crude Daily
West Texas Intermediate Crude Weekly

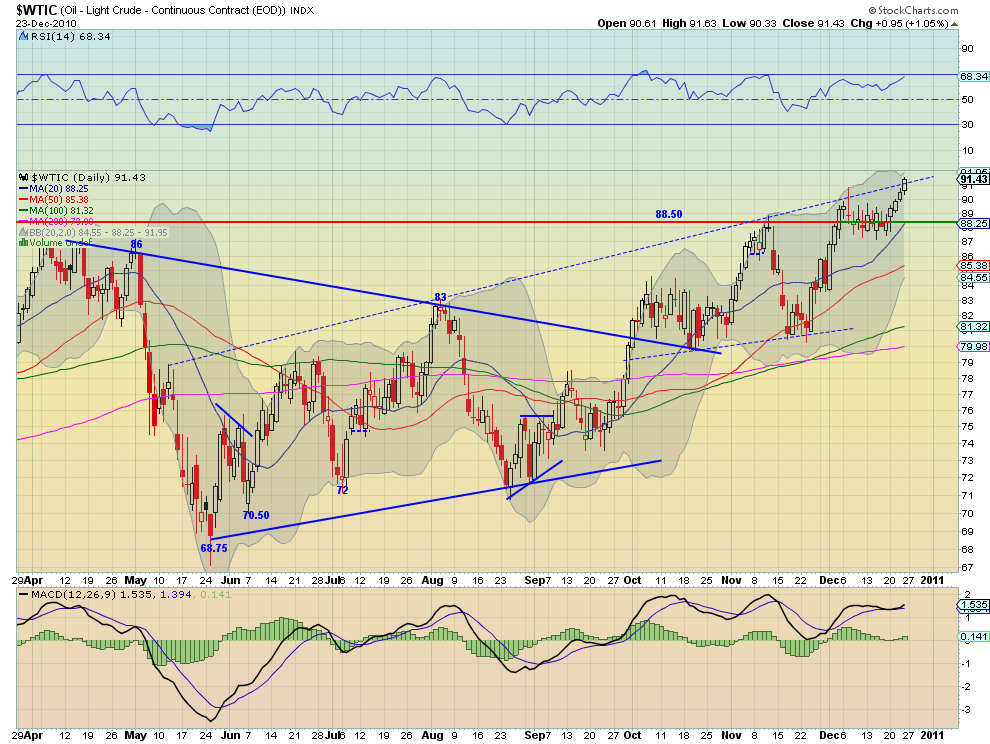
Crude Oil is not only ready to take off it is already full speed down the runway. The daily chart shows a break out from the consolidation around the 88.50 support/resistance area and bull flag. The MACD and RSI are rising and the Bollinger bands are getting very tight. Expect the move up to continue and perhaps accelerate. The weekly chart is also quite bullish, stepping higher into the 88.50 to 100 consolidation zone from late 2007. The RSI suggests that there is a lot more room to run higher and with all of the SMA’s pointing higher, there are green lights everywhere.
US Dollar Index Daily
US Dollar Index Weekly

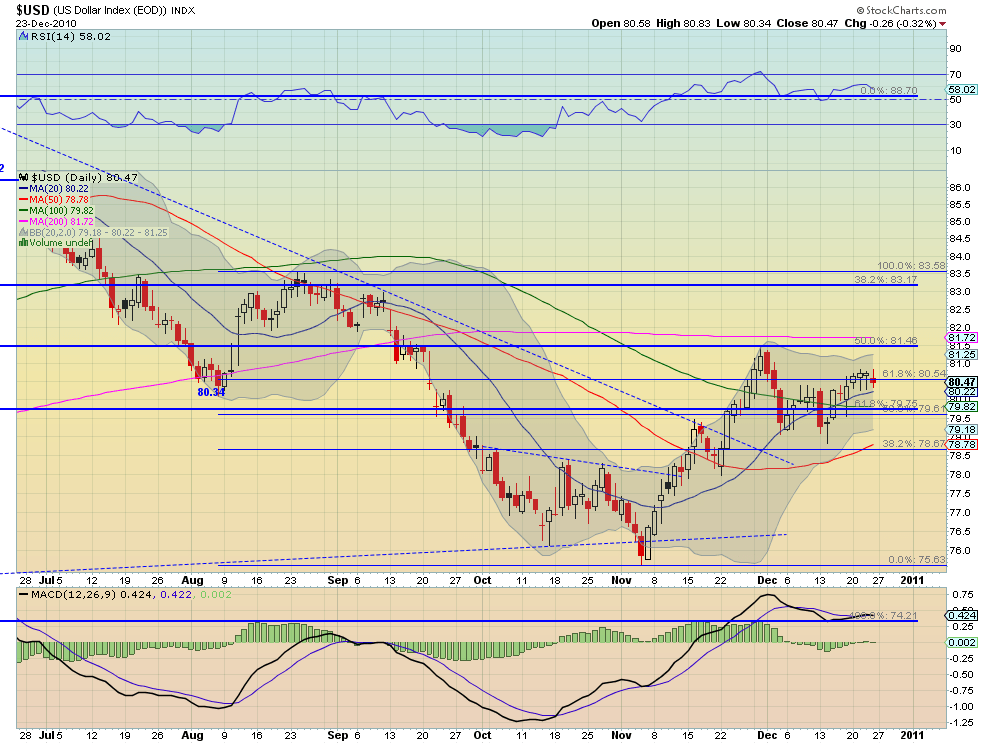
The US Dollar Index held a double bottom last week, moved higher and is now consolidating around the 61.8% retracement of the downward move from August to November, at 80.54. The MACD had been improving but looks to be leveling now and the RSI is also fairly flat, so a catalyst could push it either way. The tightening Bollinger bands suggest that a move is going to happen soon. The weekly chart shows the rising trend line holding and price continuing to rise along it. This week’s Doji following last week’s Hanging Man are suggesting a pullback might occur. But note also that these happened right at the previous support level of 80.28. There is a tangle of SMA’s that could provide both support and resistance and keep it in a range for a short while. Aside from the price, watch the RSI on the weekly chart for direction. It is at 50 and possibly leveling. If that continues lower is more likely, but if it turns above 50 and holds then the uptrend should continue.
iShares Barclays 20+ Yr Treasury Bond Fund Daily
iShares Barclays 20+ Yr Treasury Bond Fund Weekly

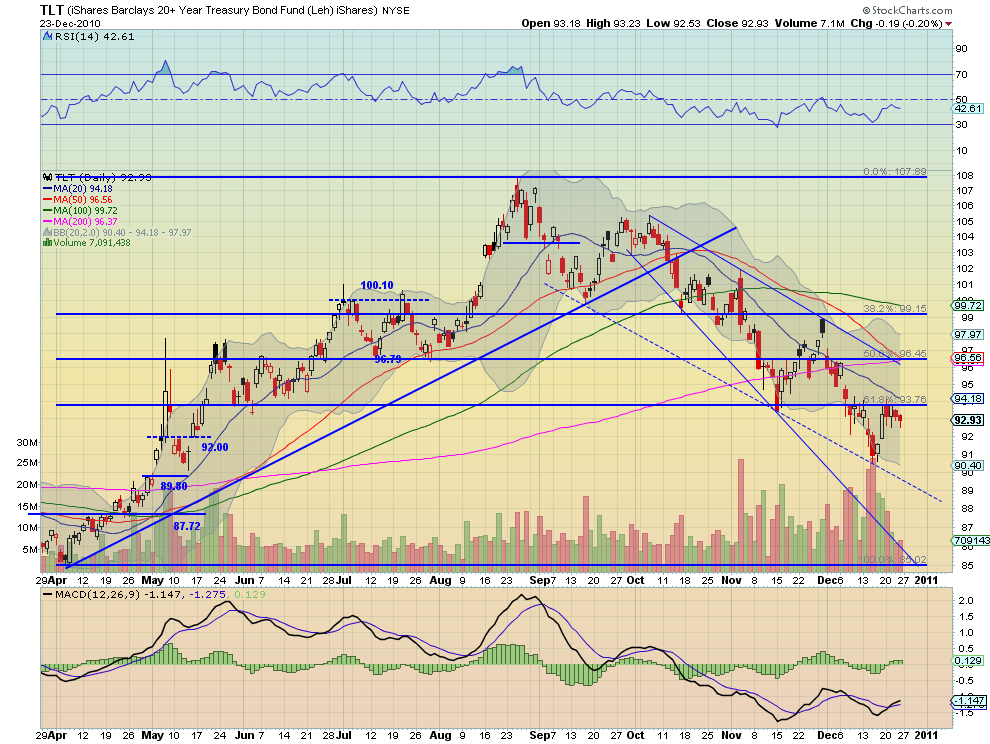
TLT bounced off of support of the downtrend line last week and this week could not get past the 93.76 level, the 61.8% retracement of the April to August rise. The downtrend is still in tact with the 20 day SMA coming down to make sure it goes lower and limit the upside. The RSI also could not get into bullish territory during the upswing and is now heading lower. More bad news, the 50 day SMA has just crossed the 100 day SMA moving down adding to the bear case. Previous support at 92 may cause a pause with support lower at 89.80. The weekly chart shows the downtrend clearly, with price sitting on support of the 100 week SMA at 93.03. The RSI is trending lower and has room before being oversold. Look for bonds to continue lower or at best sideways to the trendline next week.
Shanghai Stock Exchange Composite Daily

Shanghai Stock Exchange Composite Weekly
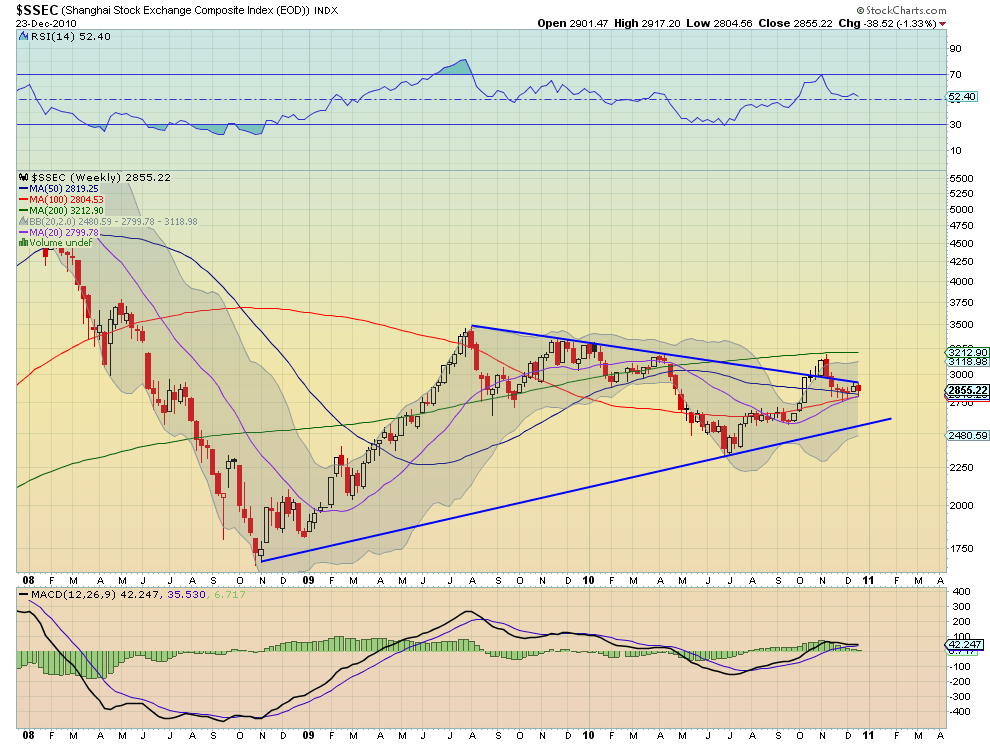
The Shanghai Composite looked like it was going to move after the rate decision two weeks ago but the 50 day SMA smacked it lower and it has been heading down ever since. look for support at the confluence of the 100 and 200 day SMA’s between 2781 and 2800 to stop the fall. The tightening Bollinger bands suggest a big move very soon. The weekly chart suggests that move might be to the upside. The 20, 50 and 100 week SMA’s are clustered together as support and the squeezing price to the top rail of a symmetrical triangle. If it gets through the triangle then there is resistance at the 200 week SMA higher and then 3500.
iShares MSCI Emerging Markets Index Daily

iShares MSCI Emerging Markets Index Weekly
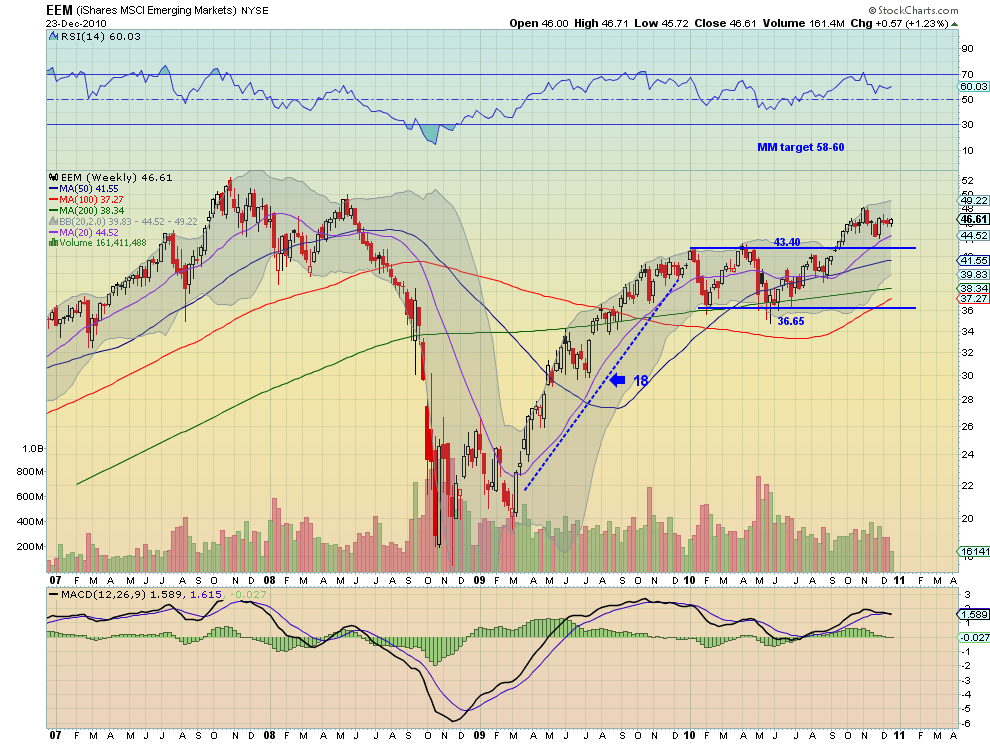
I have described the daily chart of the EEM as a scatter chart lately but it gained a little focus this week. The support zone including the 20 and 50 day SMA’s and the gap at 46.30, is now below price. There is resistance higher at 47 and then the recent double top high near 48.78. The RSI is holding above 50, supporting further upside until it breaks solidly. The weekly chart shows the bull flag continuing after the break of the channel. It still looks like it could retest either the 20 week SMA at 44.52 or the channel as support before heading higher. Watch the weekly RSI for a clue to whether the retest of support will happen. A shift down will be the signal.
VIX Daily
VIX Weekly
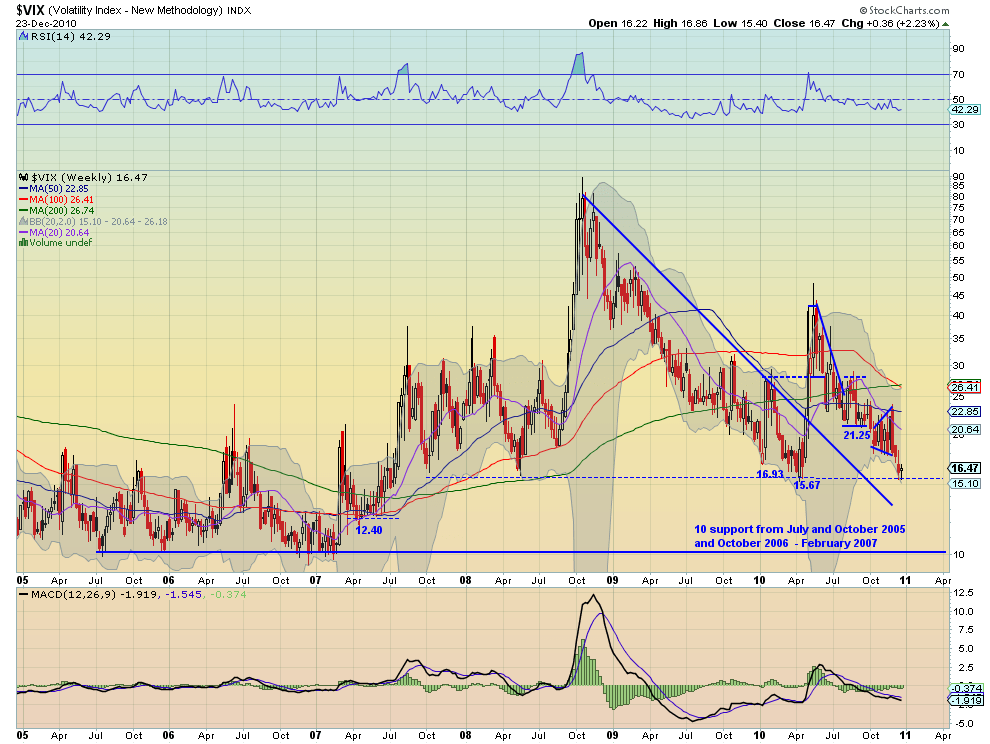
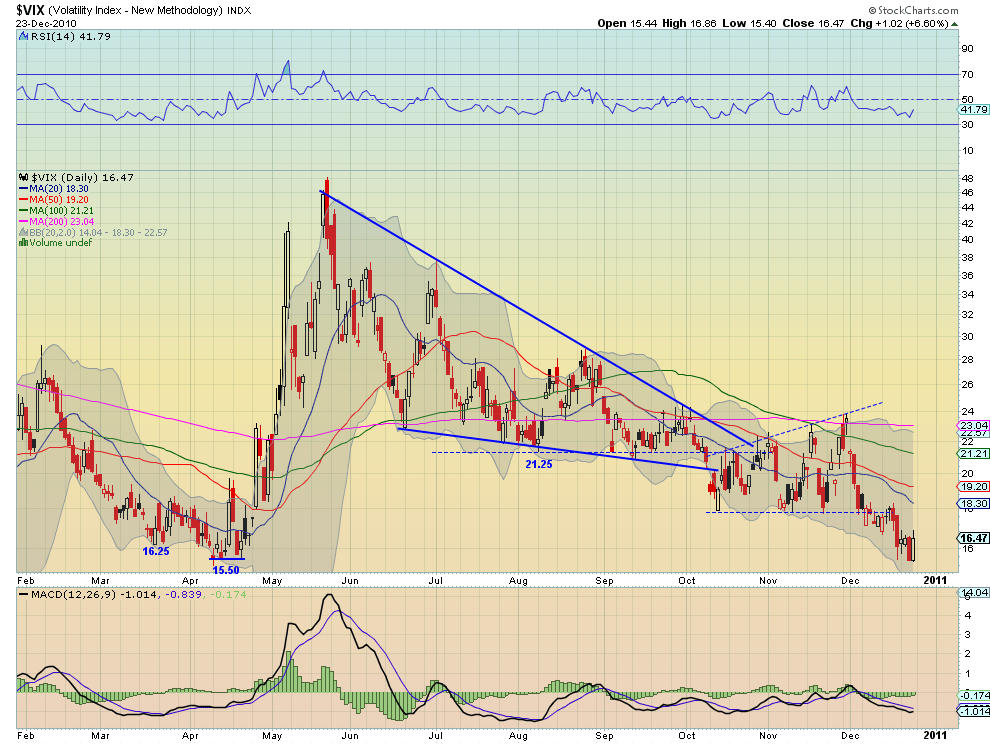
The Volatility Index found support at 15.50 after falling out of the broadening wedge last week. It now sees resistance higher at 18 on the daily chart. The weekly chart also presents the case for a bounce, printing a Doji this week at support. Despite that the trend is lower and I expect it to break that support shortly, as the RSI is trending and pointing lower and the MACD has just moved further to the downside.
SPY Daily

SPY Weekly

The SPY paused for a few days at the previous level of resistance, 124.97, the high of September 2008, before heading higher this week. The RSI is getting a little overbought on the daily chart so it may consolidate for a short time before moving again. A further move higher is supported by all the SMA’s pointing higher. The weekly chart also looks higher going forward. The next resistance level is at 127 and then 131.36 above that. The RSI and MACD are supporting a run higher as well.
IWM Daily

IWM Weekly
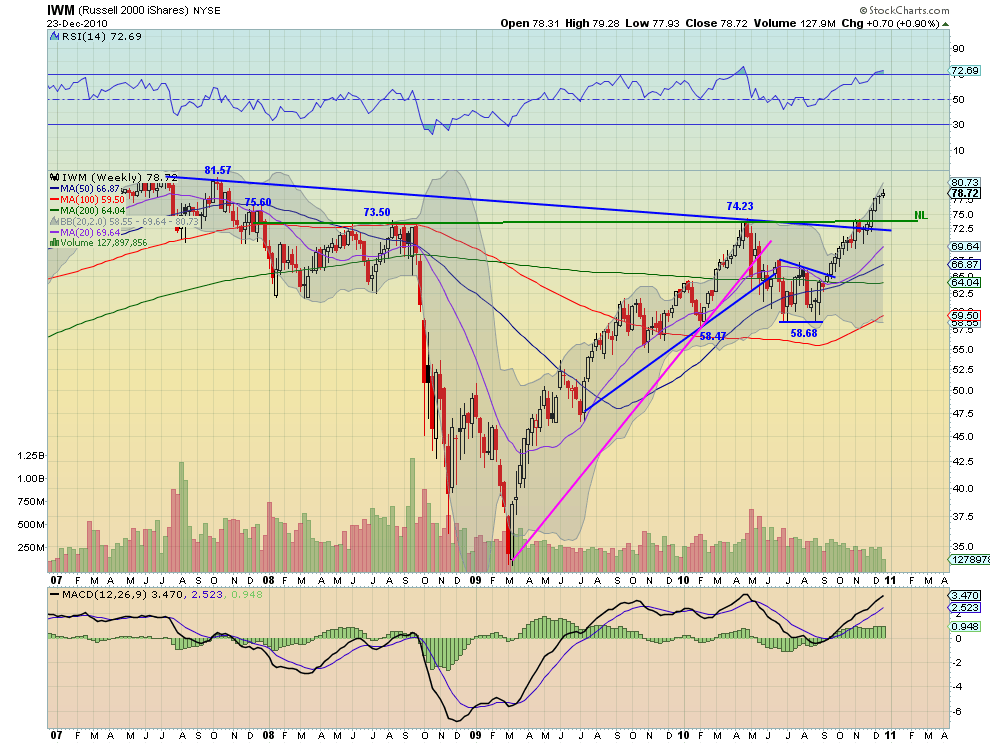
IWM retested the December 2007 level of 76.75 and then moved higher to resistance at 79.10 from November 2007. It is now consolidating. It is slightly overbought on the RSI so it may rest here or pullback slightly in the short run, but the trend remains higher. The weekly chart shows that trend breaking the neckline of the inverse head and shoulders and previous downtrend with only a slight pause. It is also getting slightly overbought at it approaches the 81.57 resistance level and may rest or pullback slightly before running higher.
QQQQ Daily
QQQQ Weekly
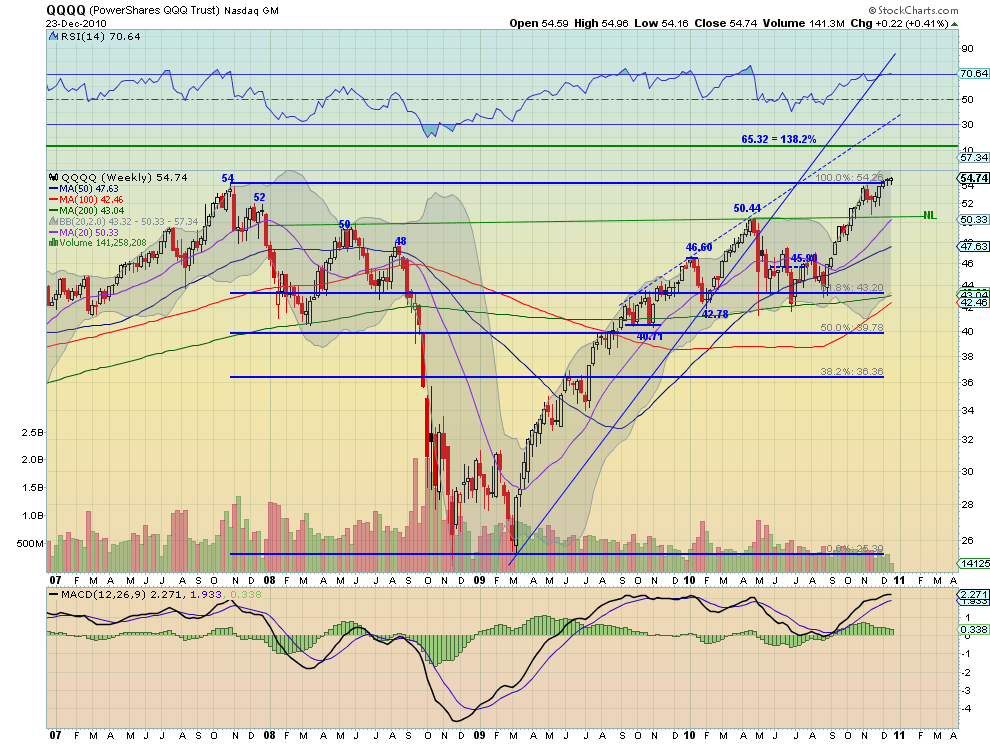
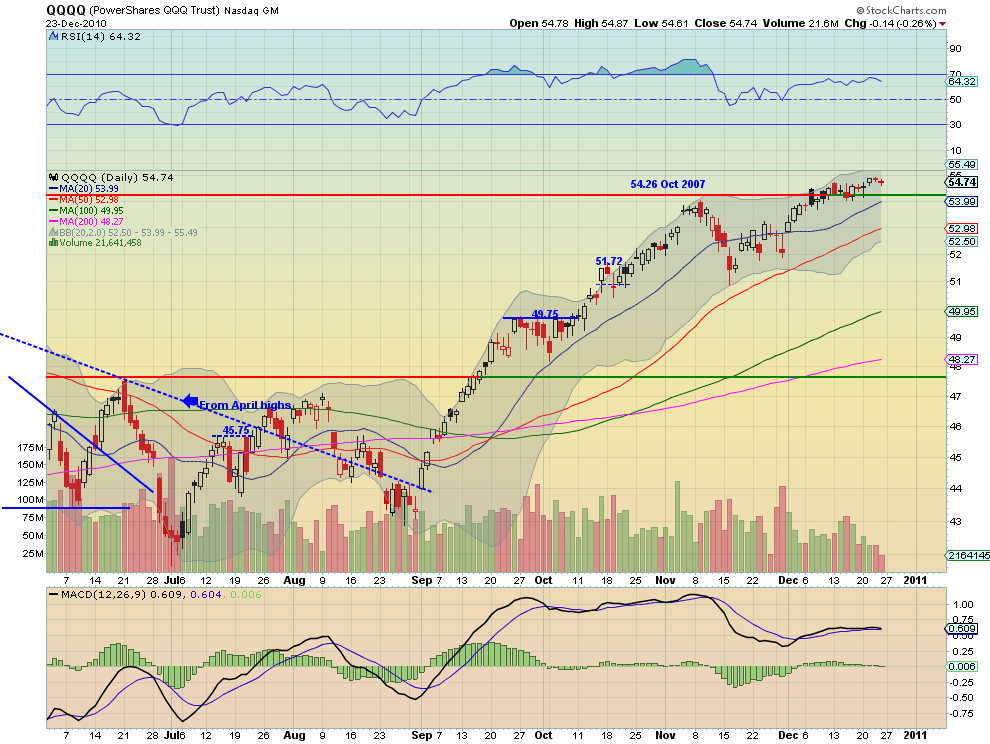
The QQQQ has found some resistance at the previous high from October 2007 at 54.26, and is now clearing it. This is not surprising as there is now clear space on the chart back to 2000. The RSI flat lining near the 70 level support further consolidation in the near term, but the trend, as exhibited in the SMA’s, is still up. The weekly chart has the same characteristics, rising SMA’s, RSI near overbought territory and a pause at resistance. This adds weight to the possibility of a pause occurring, before a move to new 10 year highs.
So next week looks a little bleak for Gold and Treasuries, but higher for Crude Oil. The US Dollar Index may run sideways before a move higher. The Shanghai Composite and emerging markets are waiting for a catalyst, probably the same one that will move the US Dollar Index. The Volatility Index looks lower but even if it bounces it will not be enough in itself to hold back the equity markets. Those equity markets, SPY, IWM, QQQQ are all looking a little tired in the very short term and may continue to consolidate or slightly pullback next week on their way to higher levels down the road.
Trade’m well.
If you like what you see above sign up for deeper analysis and trading strategy by using the Get Premium button above. As always you can see details of individual charts and more on my StockTwits page.
The information in this blog post represents my own opinions and does not contain a recommendation for any particular security or investment. I or my affiliates may hold positions or other interests in securities mentioned in the Blog, please see my Disclaimer page for my full disclaimer.
blog comments powered by Disqus
-
 Gregory W. Harmon CMT, CFA, has traded since 1986 and held senior positions including Head of Global Trading, Head of Product Development, Head of Strategy and Director of Equity. (More)
 -
Subscribe to Dragonfly Capital Views
Lifetime Subscription
$4,000.00Sign upAnnual Subscription
$1,000.00Sign upQuarterly Subscription
$350.00Sign up
Recent Posts
- Bull Scan for 10-14-26
- Premium Earnings 10-13-26: Fastenal and Morgan Stanley
- Bull Scan for 10-13-26
- Premium Earnings 10-12-26: Citigroup and Johnson & Johnson
- 4 Trade Ideas Wells Fargo: Bonus Idea
- 5 Trade Ideas for Monday: AbbVie, Airbnb, Affirm, GE Aerospace and Walmart
- Top Trade Ideas for the Week of October 12, 2026: The Rest Premium
- Top Trade Ideas for the Week of October 12, 2026: The Best
- SPY Trends and Influencers October 10, 2026
- Macro Week in Review/Preview October 9, 2026
Archives