Macro Review/Preview October 2010: Monthly Investor Addendum
- Posted by Greg Harmon
- on October 29th, 2010
Last month in this space my Monthly Macro Review/Preview suggested Gold would continue its move higher and potentially start a steeper climb. Oil may joining the party after moving strongly off of its base. The US Dollar index appeared very sick. US Treasury prices seem poised to move higher, further reducing yields, although they may wander on the way up. The Volatility Index was unlikely to be a factor for at least a couple of months until the shorter SMA started to play a role. All of this lead to an environment where the Equity ETF’s SPY, IWM and QQQQ were set up to move higher from the monthly charts. Let’s see what happened and what can be gleaned about the future of the market.
(As always you can see these individual charts and more on my twitter feed and on chartly.)
Gold Monthly
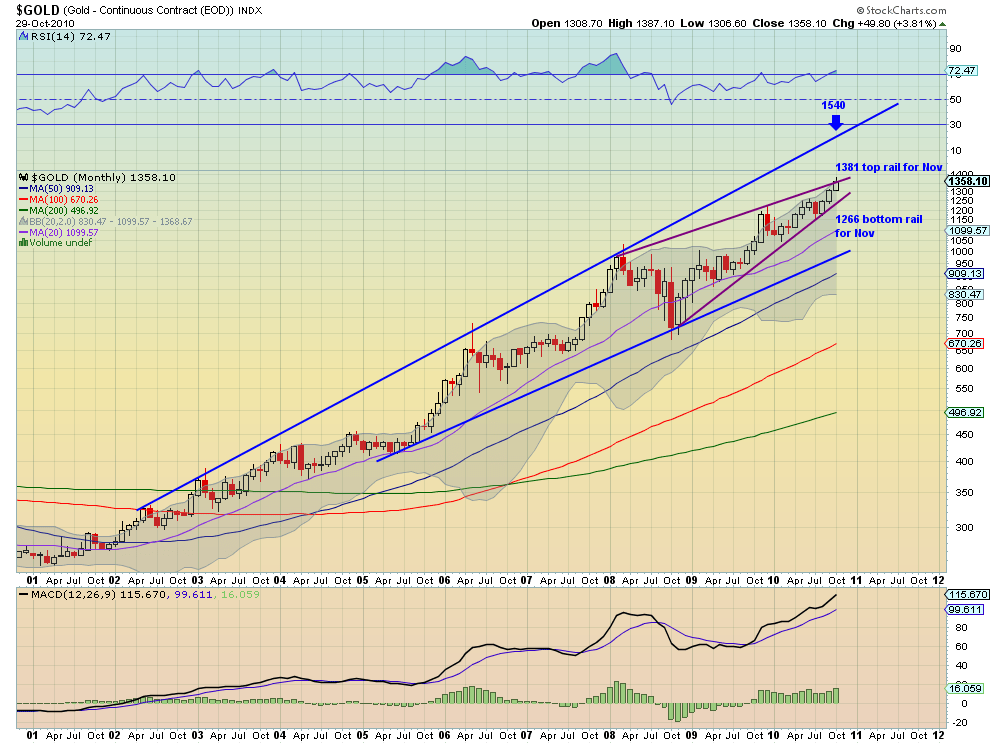
Gold did move higher in October, but remained within the tightening wedge within the rising channel, It is testing the top of the wedge now and will see resistance at 1381 this month. Again if it can get through this resistance then it could race higher to the top of the channel, as it has done previously, at 1540. Should it reject at 1381 then there is support at 1266 from the bottom rail followed by the 20 month Simple Moving Average (SMA) at 1099.57. it is showing signs of a continued strong uptrend as it is up against the top of the Bollinger bands, the Relative Strength Index (RSI) is high but not too extended and the Moving Average Convergence Divergence (MACD) indicator is rising. Expect higher Gold prices.
West Texas Intermediate Crude Monthly

Crude Oil could not break higher off of September’s move from the 20 month SMA base and is in the range between 67.70 and 88.5. After a year in this range the Bollinger bands are tightening so a move out should happen soon. The RSI near 50 and the MACD near zero give little clue as to which direction the break out might occur. Above 88.50 it will be in a new range up to 98.50 and below 67.70 it can drop to 51.54. There is support along the way at the 50 and 20 month SMA’s, 77.60 and 73.26.
US Dollar Index Monthly
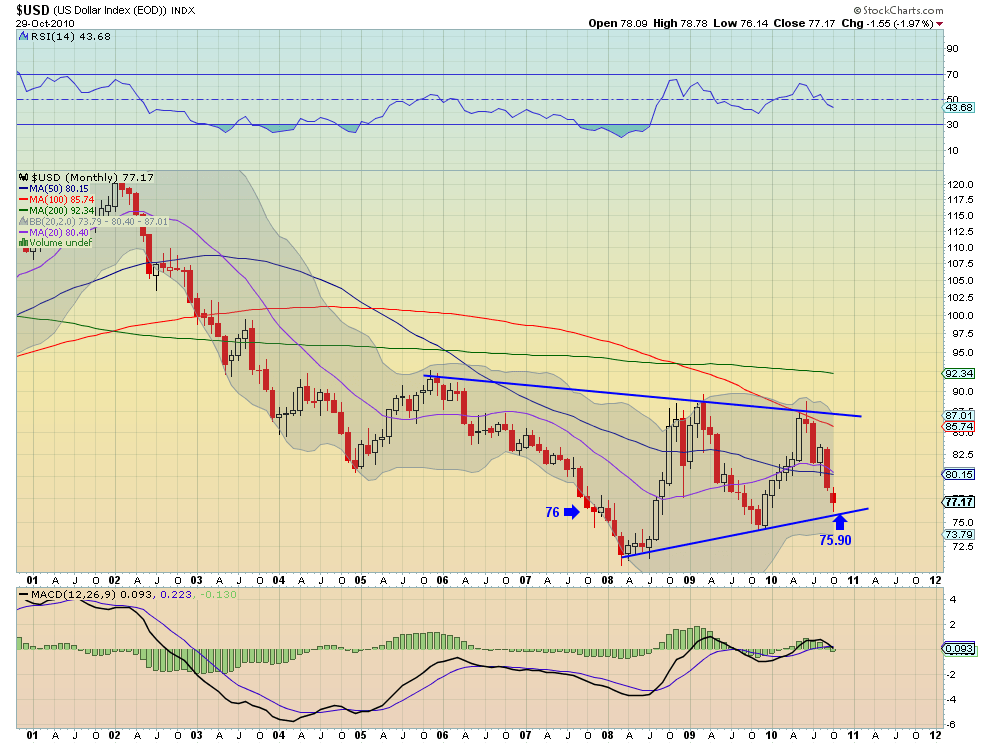
The US Dollar Index did move lower testing the lower rail of a symmetrical triangle. This rail is support and if it does not hold then support is first found lower at 71.50, and the target from a break of the pattern would be 57.50. That would truly be amazing! If it bounces off of the rail then resistance can be found at 80.15-.40, the 50 and 20 month SMA’s and then the 100 month SMA at 85.14 and the top rail. The falling RSI and MACD indicator suggest a move lower still.
iShares Barclays 20+ Yr Treasury Bond Fund Monthly
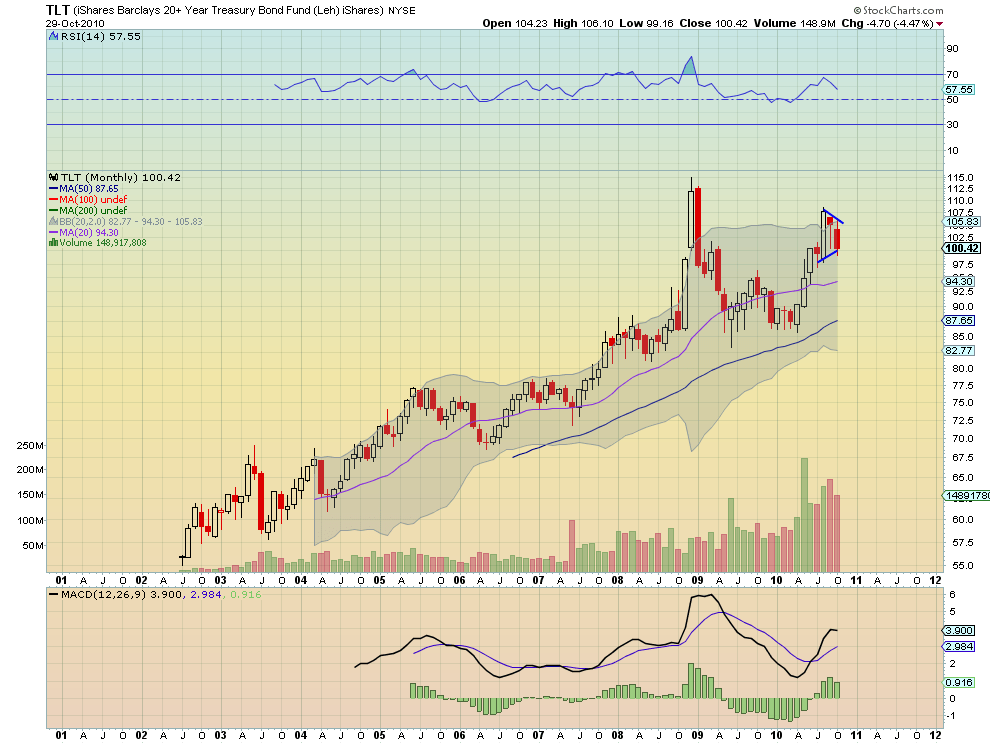
The proxy for US Treasury Bonds, TLT, did not continue higher in a bull flag but morphed into a symmetrical triangle. If it breaks out lower, below 100, then support can be found at 95.50 followed by and a target from the pattern of 90. If it breaks higher, above 105, resistance is found at 107.50 and then 112.50. The falling RSI and rolling MACD suggest a move lower.
iShares MSCI Emerging Markets Index Monthly
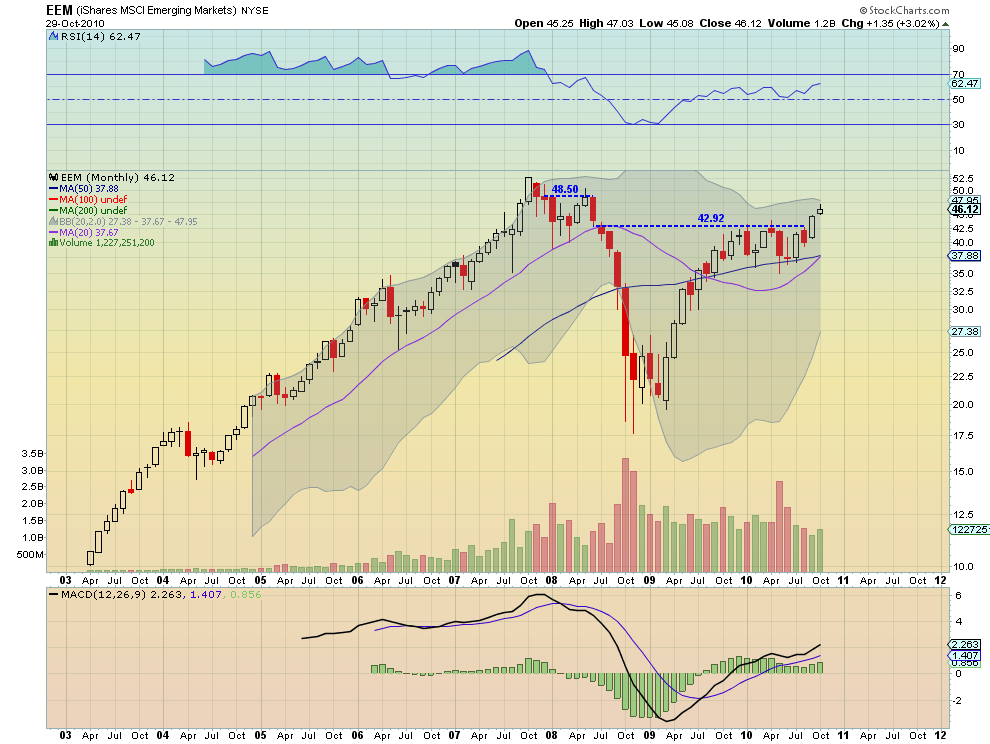
New this month, the proxy for Emerging Markets, EEM, shows a break of resistance (now support) at 42.92 in September and a continued move higher this month. Resistance on the move up will come at 48.50 followed by 53 from October 2008. The rising RSI and MACD support higher prices.
VIX Monthly
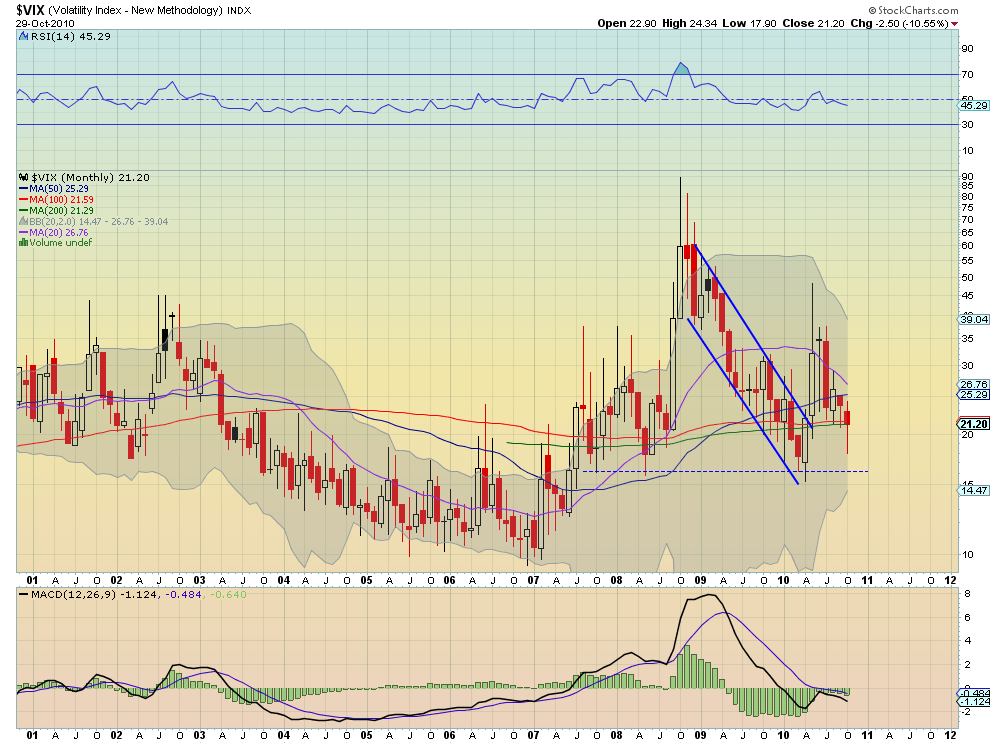
The Volatility Index printed a Bullish hammer in a downtrend, near support of the 200 month SMA, at 21.29 after testing lower. This must be confirmed next month. The Index did not have much influence over the equity markets in October. If this hammer is confirmed then there is resistance at 25.29 and then 26.76, the 50 and 20 month SMA’s. If it fails then support can be found at 18 followed by 16 lower.
SPY Monthly
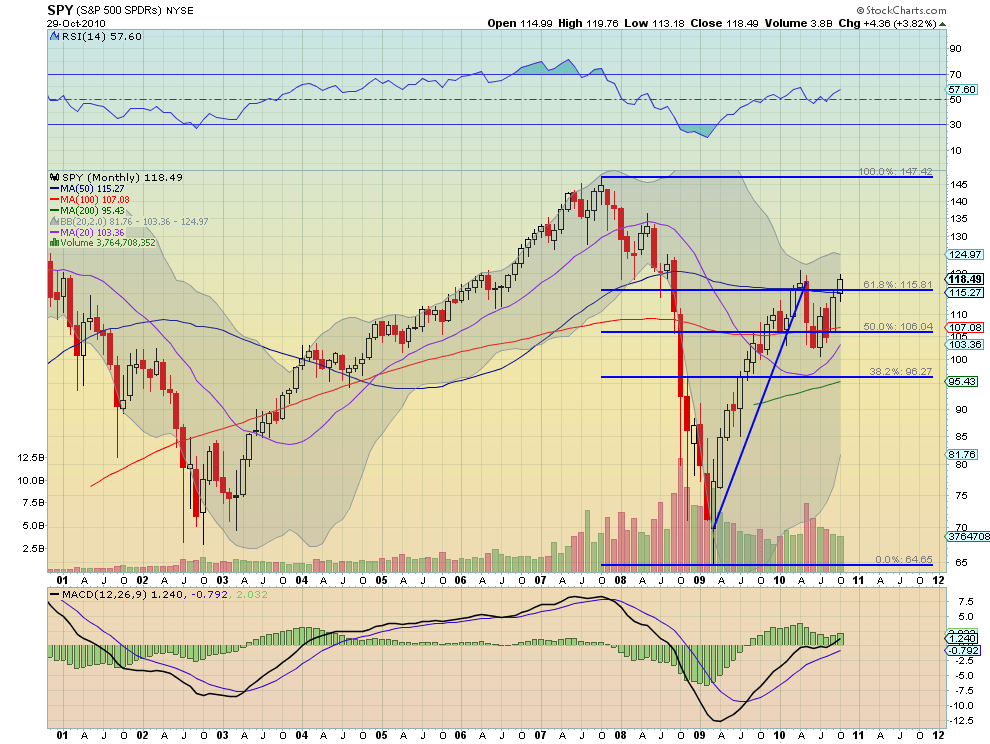
The SPY continued to move higher in an uptrend with a rising RSI and MACD indicator. It looks to test the testing April 2010 highs at 120.89. Through that level it will see the next resistance at 124 then 134. there is support at 115.80 followed by 112.80 below. A break of 120.89 is the key.
IWM Monthly

The IWM also moved higher off of its basing just under the 61.68 and through the 66 resistance (now support) level. The RSI and MACD are rising for IWM as well and give it support as it moves higher to try a run to resistance at 72.4 or 74.36 above that. It would be more positive if the volume was rising and not diverging with the price movement.
QQQQ Monthly
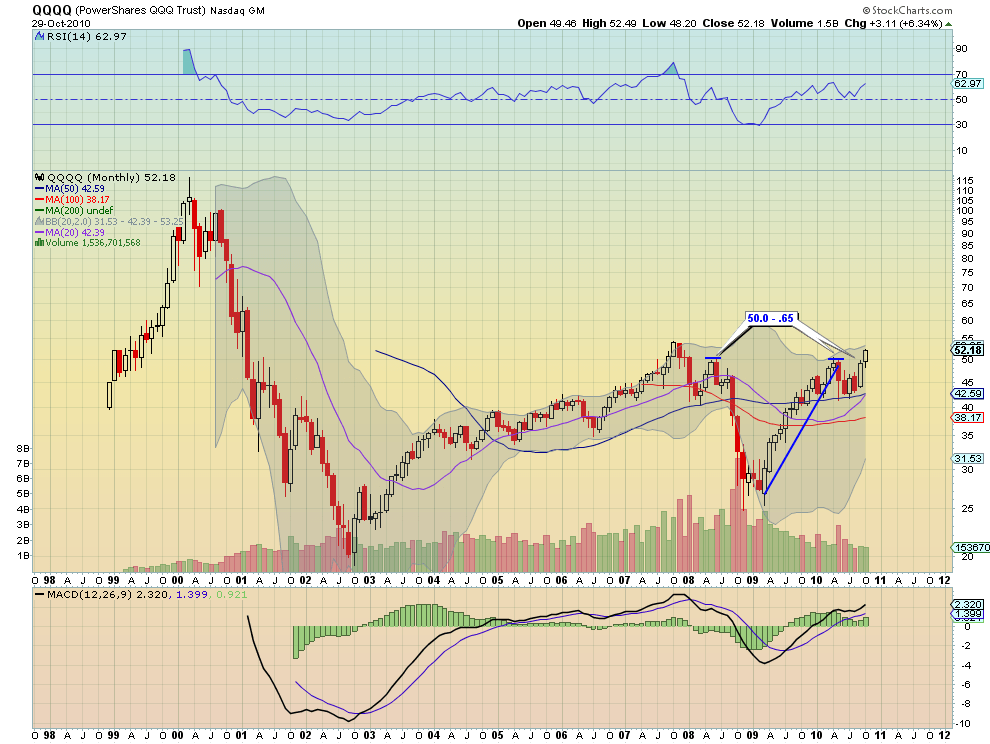
The QQQQ also looks great on the monthly chart and did move higher from September. It also has rising RSI and MACD. After passing the December 2008 high of 52.11 (now support) it looks to move up to the October 2008 high of 54. If it gets through that then resistance comes at 63 from 2001 and 78 from 2000! Support lower can be found at 50.0-.65 followed by 46.8 and the 42.4-.6 area.
Heading into November the charts look positive for Gold, as well as the emerging market ETF. Watch for resolution of the flag on US Treasuries, I am biased to the downside. Crude Oil is more mysterious and needs close attention to get clues of its next direction. The US Dollar Index appears to be headed lower. The the equity index ETF’s, SPY, IWM and QQQQ all look good for more upside on a monthly basis.
If you interested in shorter time frames then here is the Week in Review/Preview
Good luck next week!
If you like what you see above sign up for deeper analysis and trading strategy by using the Get Premium button above. As always you can see details of individual charts and more on my StockTwits page.
The information in this blog post represents my own opinions and does not contain a recommendation for any particular security or investment. I or my affiliates may hold positions or other interests in securities mentioned in the Blog, please see my Disclaimer page for my full disclaimer.
blog comments powered by Disqus
-
 Gregory W. Harmon CMT, CFA, has traded since 1986 and held senior positions including Head of Global Trading, Head of Product Development, Head of Strategy and Director of Equity. (More)
 -
Subscribe to Dragonfly Capital Views
Lifetime Subscription
$4,000.00Sign upAnnual Subscription
$1,000.00Sign upQuarterly Subscription
$350.00Sign up
Recent Posts
- Bull Scan for 10-14-26
- Premium Earnings 10-13-26: Fastenal and Morgan Stanley
- Bull Scan for 10-13-26
- Premium Earnings 10-12-26: Citigroup and Johnson & Johnson
- 4 Trade Ideas Wells Fargo: Bonus Idea
- 5 Trade Ideas for Monday: AbbVie, Airbnb, Affirm, GE Aerospace and Walmart
- Top Trade Ideas for the Week of October 12, 2026: The Rest Premium
- Top Trade Ideas for the Week of October 12, 2026: The Best
- SPY Trends and Influencers October 10, 2026
- Macro Week in Review/Preview October 9, 2026
Archives