Looking Ahead: The Russell, IWM and Nasdaq, QQQQ
- Posted by Greg Harmon
- on December 29th, 2010
As a reminder, this series of articles as a collection are intended to help frame the potential outcomes of the coming 12 months or so of the global markets. They are not intended to be a forecast per se, but to provide longer term deeper insight based on the current market structure. Each article is complete in itself, but the series together will provide a whole world focus, and as usual they will focus on price action, meaning there will be charts. Full schedule is here.
The Russell, IWM
The Russell 2000, or small cap index, is the first of the major US Indexes. It often leads the large cap indexes, mainly due to higher growth companies being included. I use the ETF, IWM, for this space. The monthly chart is below.
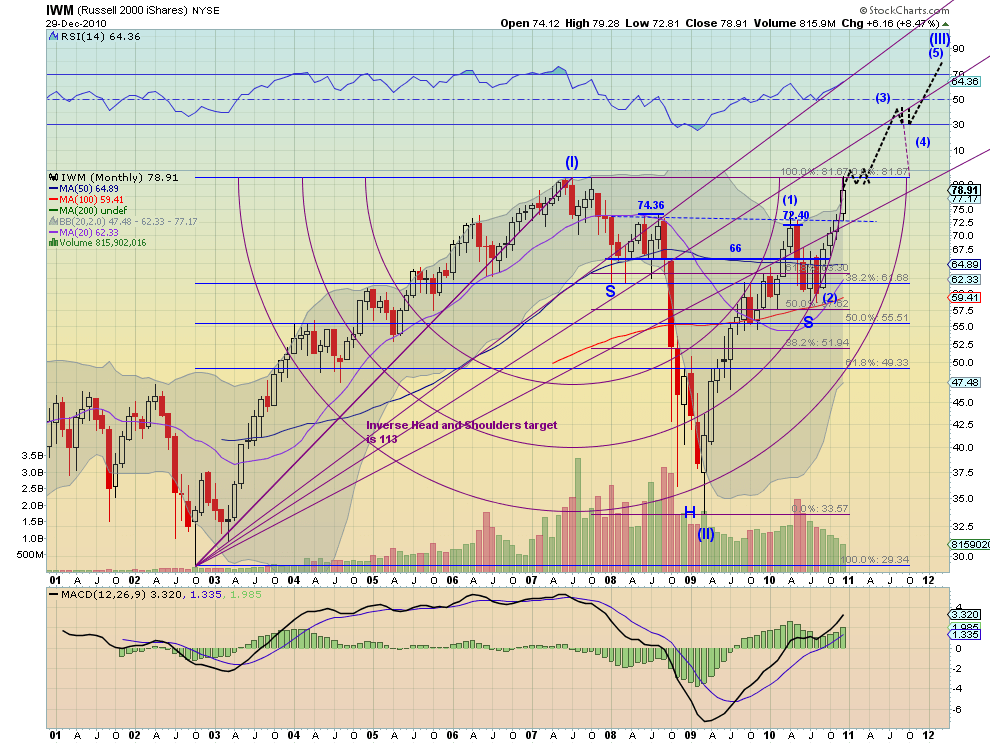
There is a lot going on in this chart. First, the move from the June 2007 high to the low in March 2009 has nearly been retraced 100%. Next During that downward move and then the upward reversal a massive 3 year Inverse Head and Shoulders pattern was created, with a neckline break at 73 last month. Note also that the Fibonacci arc contained the down move, and that the move higher was mostly contained between two arcs, with sideways action upon reaching a Fibonacci retracement level. The last move up, in fact, started when price, traveling along the 61.8% retracement level, met the Fibonacci arc and has rode the arc higher since. The oscillators are look positive for the future as well with the MACD rising and the RSI rising with lots of room before it starts to get technically overbought. The Bollinger bands are starting to tighten also. There are lots of lines on this chart but if you look closely you will also see the 20 month SMA recently crossed the 100 month SMA higher and is heading to cross the 50 month SMA. Finally, it may be in wave (III) of an impulse wave higher.
Russell 2000, IWM – Long term target 111 -118
Clearly the trend is higher. It would be natural for there to be a pause at least at the 81.67 level, but IWM looks to go much higher. There are three methods that can be applied to reach the price target. The first looks at the retracement of the move from the 2007 high to the 2009 low. Upon breaking the 81.67 level, a full retracement, the next target would be a 161.8% retracement of that move. This is where the 111 target comes from, 161.8% of the 48 point downside move added back to the bottom at 33.57. The second method is from the Elliott Wave Principle. Wave (III) of an impulse wave cannot be the shortest wave and is frequently the longest. The symmetry between the wave movements suggest a 161.8% wave (III) compared to wave (I). Since wave (I) was 52.33 points, adding 161.8% of that to the start of wave (III) at 33.57 yields the high end target of 118. The third method is from projecting completion of the Inverse Head and Shoulders target. The distance from the bottom of the head to the neckline of 40 points, added to the neckline break level of 73, yields a target of at least 113. Interestingly a 3×1 reversal point and figure chart with a 1 point box size has a current price objective of 105.
The Nasdaq, QQQQ
The Nasdaq 100 or Triple Q’s representing the largest non-financial companies listed on the NASDAQ, can be traded through the ETF, QQQQ (still don’t understand the last Q). This makes it very technology focused. Below is the monthly chart for QQQQ.

This chart is very similar that of IWM above, lots to take note of. Start with the dot.com crash beginning in 2000 and culminating in 2002. QQQQ is now making a second run at a 38.2% retracement of that move at 56.55. It has also recently broken above a 100% retracement of the down move from October 2007 high to the low in March 2009 at 54.26, eerily close to the previously mentioned level. Next, within the 2007 to present round trip there is an Inverse Head and Shoulders that formed and pierced its neckline just above 50 in October. All of the SMA’s are pointing higher and the 20 month SMA crossed through the 50 month SMA 2 months ago. The momentum oscillators RSI and MACD have both been trending higher since the 2009 price low. On the more complicated front, the down move in 2009 was halted near the Fibonacci arc. After retaking the higher level arc, price rode the arc higher to the Fibonacci fan and then turned right to the next arc and was riding it higher, to the next fan line and now moving along the fan line again. Finally, it may also be in wave III of an impulse wave heading higher.
Nasdaq 100, QQQQ – Long term target 76 – 81.50
Here as well the trend is higher. If price continues along the prior path it can be expected that a break of the 38.2% retracement level would occur in the next 2 months, followed by a move higher along the projected arc to the next fan line and its intersection with the 50% retracement line. The dotted black line is a possible path to the target area. This target zone can be found using three methods. The first is a straight 61.8% retracement of the major down move from 2000 to 2002 at 79.63. The second method is the target for the completion of the Inverse Head and Shoulders pattern. With the bottom of the head at 24.74 and the neckline break at 50.50 the pattern target is 76.26. The third method uses Elliott Wave Principle to forecast wave III length at 161.8% of wave I or 56.75 added to the base of 24.74 to yield a target of 81.50. These targets roughly coincide with a trend line that could be drawn from tops in January 2004 and October 2007 extended through to 2012. Also the 3×1 reversal point and figure chart with a 1 point box size has a current price objective of 77.
(As always you can see details of any individual charts and more on my twitter feed and on chartly.)
If you like what you see above sign up for deeper analysis and trading strategy by using the Get Premium button above. As always you can see details of individual charts and more on my StockTwits page.
The information in this blog post represents my own opinions and does not contain a recommendation for any particular security or investment. I or my affiliates may hold positions or other interests in securities mentioned in the Blog, please see my Disclaimer page for my full disclaimer.
blog comments powered by Disqus
-
 Gregory W. Harmon CMT, CFA, has traded since 1986 and held senior positions including Head of Global Trading, Head of Product Development, Head of Strategy and Director of Equity. (More)
 -
Subscribe to Dragonfly Capital Views
Lifetime Subscription
$4,000.00Sign upAnnual Subscription
$1,000.00Sign upQuarterly Subscription
$350.00Sign up
Recent Posts
- Bull Scan for 10-14-26
- Premium Earnings 10-13-26: Fastenal and Morgan Stanley
- Bull Scan for 10-13-26
- Premium Earnings 10-12-26: Citigroup and Johnson & Johnson
- 4 Trade Ideas Wells Fargo: Bonus Idea
- 5 Trade Ideas for Monday: AbbVie, Airbnb, Affirm, GE Aerospace and Walmart
- Top Trade Ideas for the Week of October 12, 2026: The Rest Premium
- Top Trade Ideas for the Week of October 12, 2026: The Best
- SPY Trends and Influencers October 10, 2026
- Macro Week in Review/Preview October 9, 2026
Archives