Looking Ahead: Gold and Silver
- Posted by Greg Harmon
- on December 21st, 2010
As a reminder, this series of articles as a collection are intended to help frame the potential outcomes of the coming 12 months or so of the global markets. They are not intended to be a forecast per se, but to provide longer term deeper insight based on the current market structure. Each article is complete in itself, but the series together will provide a whole world focus, and as usual they will focus on price action, meaning there will be charts. Full schedule is here.
Gold
Gold has been a magical metal for thousands of years. More recently it has backed currencies and been used as an inflation hedge. It has influence over other asset prices in many different scenarios and these are just some of the many reasons to watch gold. The 10 year monthly and the 3 year weekly charts for gold are below.
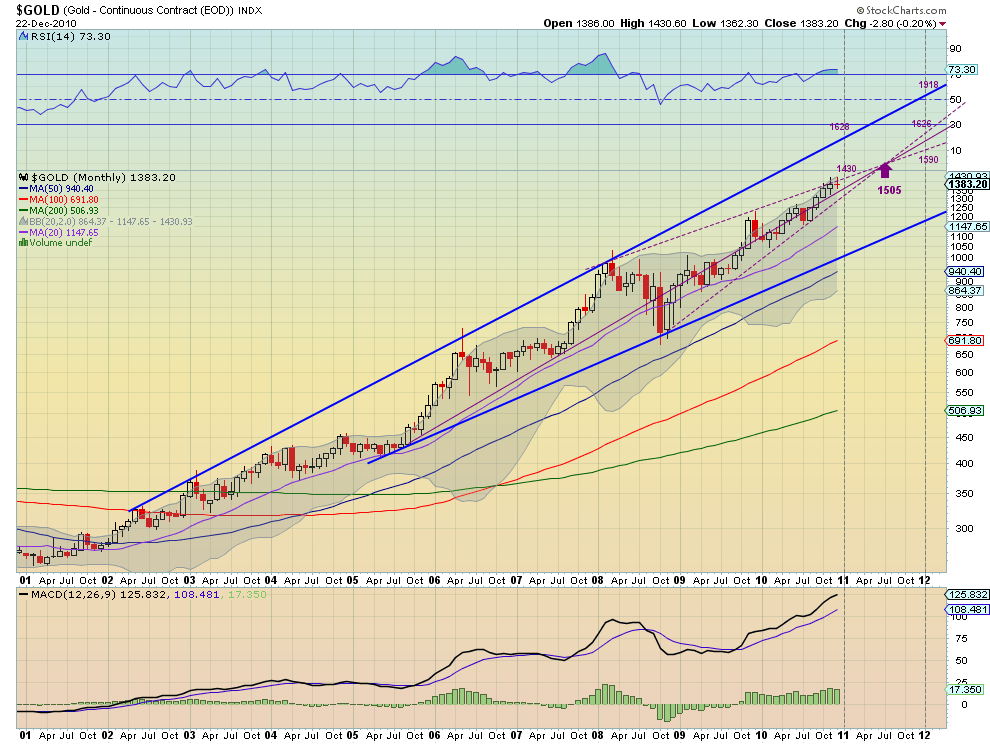
The first thing to notice with Gold is that it has been in a strong uptrend for 10 years. It has occasionally fallen back to the 20 month SMA or the middle of the Bollinger band channel, but with the exception of a two month dip in October and November 2009 where the RSI dipped below 50, it has remained very strong. All of the SMA’s are traveling higher and with good space between them. The Bollinger bands are remaining at a steady spread with price hugging the top line, and the MACD has been increasing. The one limiting factor in the near term appears to be the recent (2 – 3 years) dotted trend lines, which look to converge soon. Glancing at the weekly chart to get insight on any near term catalyst shows the MACD crossing lower. When this has happened previously Gold moved sideways to slightly down for few weeks.
Gold – Long term target (end of 2011) 1700
For a discussion of the target I have blown up the last 5 years of the monthly chart here.

The weekly chart suggests a sideways move early in 2011, which could stall at last dotted trend line or slightly further and then react higher to the converging lines. The monthly chart has only gone negative for more than 2 months at a time when price has exceeded the Bollinger bands. This is why I suggest a sideways move and not a down move as the top Bollinger band has not been breached. Mid 2011, where all three trend lines cross, will be a catalyst. I am not pinning a 1505 mid year target but will suggest that the cross of those three trends will move price, regardless of where price is at the time. Because price will have corrected away from the top to the middle of the Bollinger band this could be the start of an acceleration higher to my target of 1700 for year end. For you point and figure fans the current price objective on a 3×1 chart with a 10 point box size is 1610.
Silver
Silver has always been a second tier metal compared to Gold. Like the Duke compared to the King. It has day to day uses other than jewelry but still keeps some of that regal lustre as well. Below is the monthly chart for Silver.
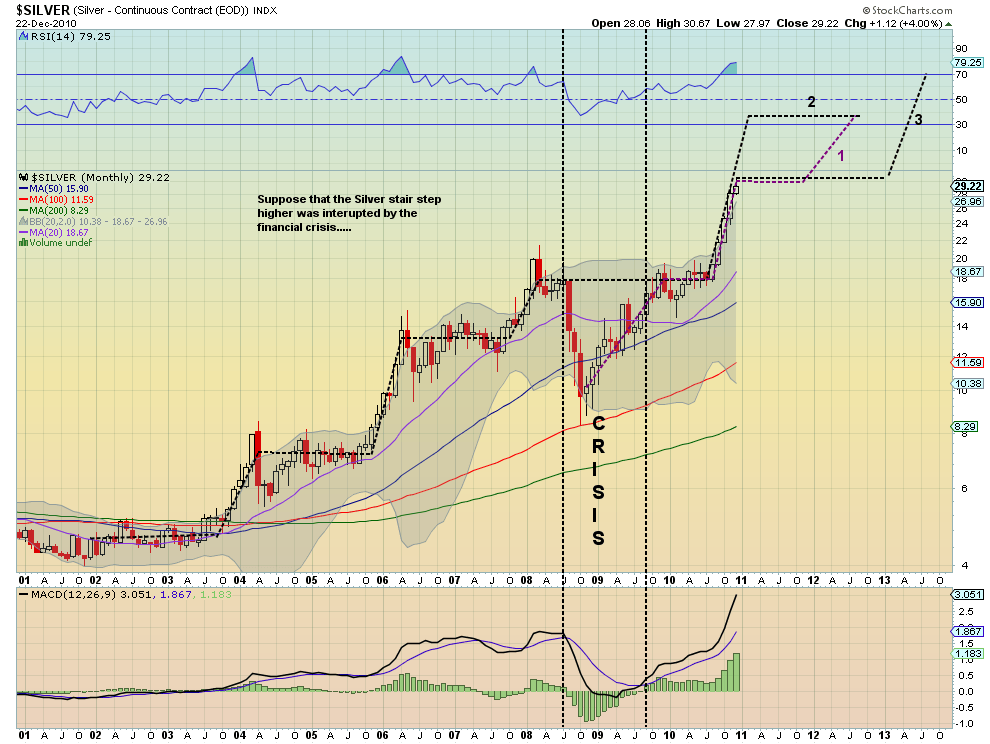
First note that Silver has exhibited a stair step pattern higher over the last 10 years. Every time it has exceeded the top of the Bollinger bands it has also been well above the 70 level, technically overbought, on RSI as well, and has subsequently had a minor sell off and then a sideways pattern before taking the next step higher. The exception to this pattern was a more exaggerated sell off during the world financial crisis, although it still bounced back and continued the pattern. Also note that throughout this cycle the Bollinger bands have widened as Silver has started the sideways move and been at their tightest as it has started the next stage higher. This suggests several paths forward. First, side ways action and then a next step higher, incorporating all activity that has happened. Second, a continuation higher, assuming the previous correction overextended to the down side and will over correct higher, followed by a a leveling. Third, Silver corrects sideways from here over some time period before taking the next step higher.
Silver – Long term target 30 through mid 2012 before next step up to 36-40
As noted above Silver is overextended on many measures. Based on historical patterns I expect that it will correct sideways for more than a year before taking the next step higher to 36-40. For the point and figure crowd a 3×1 reversal chart with a 1 point box size shows a price objective achieved at 29.10. The timing on this is complicated by the impact to price of the financial crisis, so it may be even longer. It is easier to see the trend when looking at the same monthly chart but on a linear basis, as below.
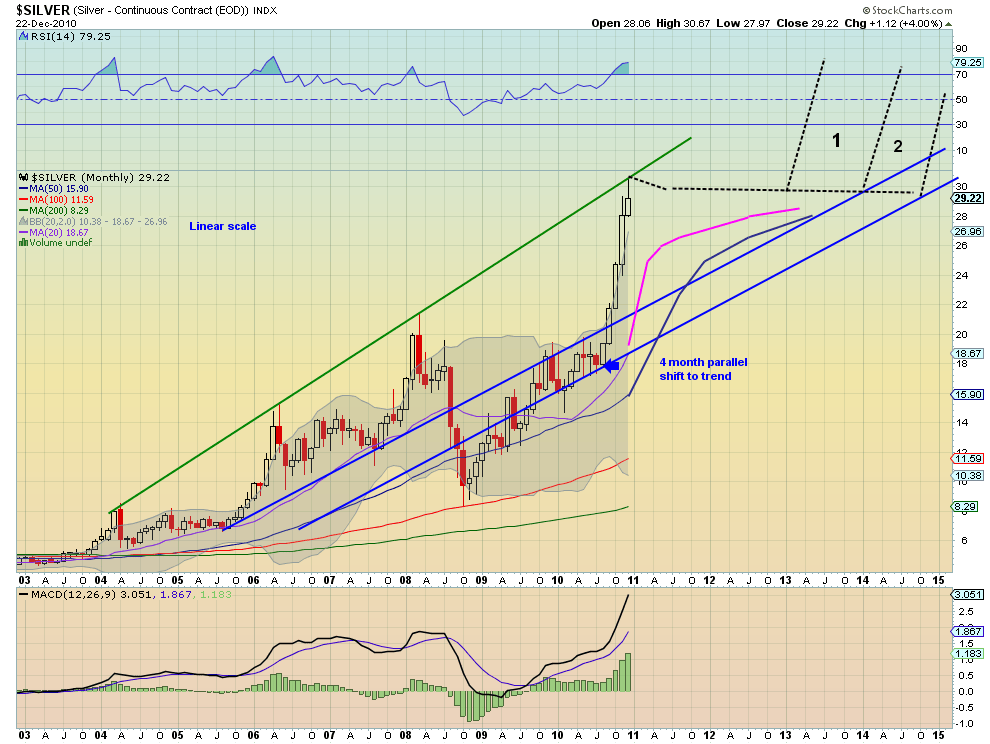
On this chart the rising trendline resistance is being touched for the fourth time, at a point outside of the Bollinger bands. The first blue trend line held before the crisis and the second is just moved forward 4 months on a parallel shift to match the turning point. Either of these (or none) could hold going forward, but look to establish a time range for the sideways correction. My expectation is that zone 1 will prevail.
Further reading here for my take on the Gold/Silver ratio.
(As always you can see details of any individual charts and more on my twitter feed and on chartly.)
If you like what you see above sign up for deeper analysis and trading strategy by using the Get Premium button above. As always you can see details of individual charts and more on my StockTwits page.
The information in this blog post represents my own opinions and does not contain a recommendation for any particular security or investment. I or my affiliates may hold positions or other interests in securities mentioned in the Blog, please see my Disclaimer page for my full disclaimer.
blog comments powered by Disqus
-
 Gregory W. Harmon CMT, CFA, has traded since 1986 and held senior positions including Head of Global Trading, Head of Product Development, Head of Strategy and Director of Equity. (More)
 -
Subscribe to Dragonfly Capital Views
Lifetime Subscription
$4,000.00Sign upAnnual Subscription
$1,000.00Sign upQuarterly Subscription
$350.00Sign up
Recent Posts
- Bull Scan for 10-14-26
- Premium Earnings 10-13-26: Fastenal and Morgan Stanley
- Bull Scan for 10-13-26
- Premium Earnings 10-12-26: Citigroup and Johnson & Johnson
- 4 Trade Ideas Wells Fargo: Bonus Idea
- 5 Trade Ideas for Monday: AbbVie, Airbnb, Affirm, GE Aerospace and Walmart
- Top Trade Ideas for the Week of October 12, 2026: The Rest Premium
- Top Trade Ideas for the Week of October 12, 2026: The Best
- SPY Trends and Influencers October 10, 2026
- Macro Week in Review/Preview October 9, 2026
Archives