It Did Not Feel Like a Positive Day: QQQQ
- Posted by Greg Harmon
- on December 7th, 2010

Shortly after the close today Brian Shannon, or @alphatrends on StockTwits, put out this succinct pearl of wisdom on the market. He writes about multiple timeframes so you know he must be thinking in many directions at the same time. The message seems very simple but it covers many different aspects of the days activity. Let me explain using a chart of the QQQQ below.
QQQQ
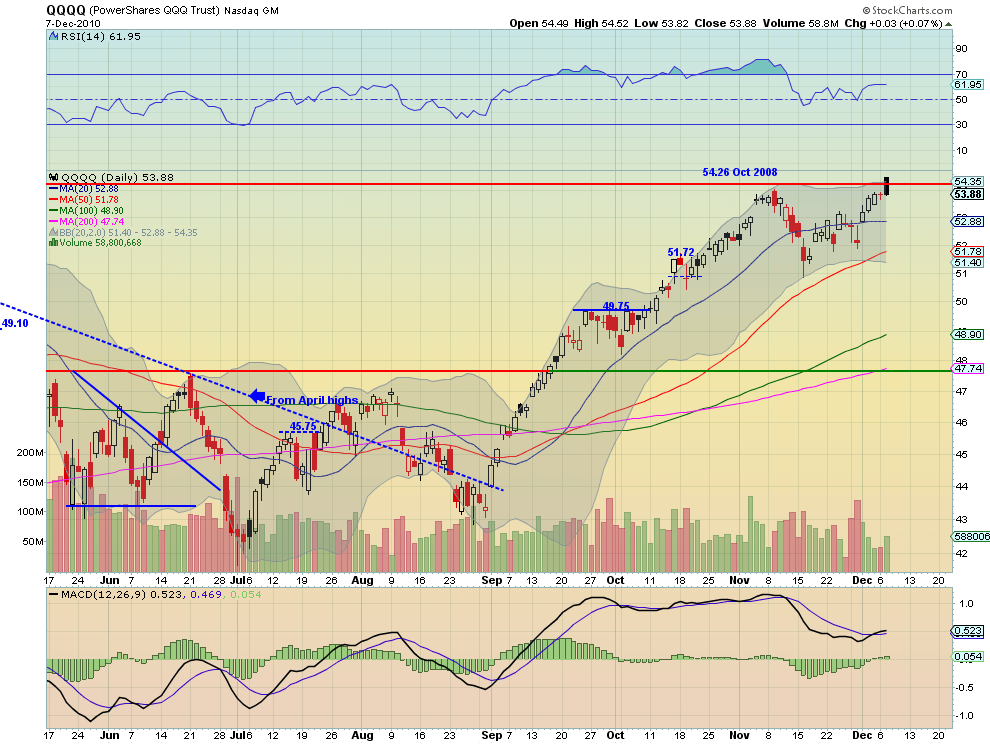
Price as always is king and it did end higher today, but there were at least 5 bearish signals today.
1. Solid Black Candle
The Solid Black Candle, the opposite of a Hollow Red Candle, illustrates graphically a bearish day. In these candles the price opened higher than the previous day and trended down for the day but closed higher than the previous day’s close. The bears were in control of the day. Filling what would be a transparent Black Candle (yes up days are transparent, not white) clearly points out this bearish bent.
2. Failure at New Multi-Year Highs
The QQQQ’s opened above the high level of 54.26 attained in October 2008. As stated above price then trended down below the that level and did not make another attempt at it, closing very near yesterday’s close. This indicates at least short term weakness.
3. Marubozu, Almost
The Marubozu Candle (third paragraph in link) is a very powerful daily trend candle. It has no shadow (some call it a tail) on either end, and indicates a continuation in the direction of the candle. In this case downward. Although technically there is a lower shadow it is very small relative to the real body of the candle, which is quite large. This is bearish.
4. Breach of the Bollinger Bands
The price today also broke through the top of the Bollinger bands. It did not close above it so it is less significant but indicates there may be at least a consolidation phase soon.
5. 20 Day Simple Moving Average Rolling Over
This is also a weaker indicator, especially when looking at the price history. If it just stays steady the 20 day SMA will start to rise as the falling channel of price closes from November 8 to November 15 start to drop off.
Time to Bail Out?
These factors are all very short term in nature so they do not mean that the price trend has changed and is going lower. They do indicate that there is a possibility for lower prices in the short term. That would not be unwelcome given the magnitude and speed of the rise.
Trade’m well.
(As always you can see details of these individual charts and more on my twitter feed and on chartly.)
If you like what you see above sign up for deeper analysis and trading strategy by using the Get Premium button above. As always you can see details of individual charts and more on my StockTwits page.
The information in this blog post represents my own opinions and does not contain a recommendation for any particular security or investment. I or my affiliates may hold positions or other interests in securities mentioned in the Blog, please see my Disclaimer page for my full disclaimer.
blog comments powered by Disqus
-
 Gregory W. Harmon CMT, CFA, has traded since 1986 and held senior positions including Head of Global Trading, Head of Product Development, Head of Strategy and Director of Equity. (More)
 -
Subscribe to Dragonfly Capital Views
Lifetime Subscription
$4,000.00Sign upAnnual Subscription
$1,000.00Sign upQuarterly Subscription
$350.00Sign up
Recent Posts
- Bull Scan for 10-14-26
- Premium Earnings 10-13-26: Fastenal and Morgan Stanley
- Bull Scan for 10-13-26
- Premium Earnings 10-12-26: Citigroup and Johnson & Johnson
- 4 Trade Ideas Wells Fargo: Bonus Idea
- 5 Trade Ideas for Monday: AbbVie, Airbnb, Affirm, GE Aerospace and Walmart
- Top Trade Ideas for the Week of October 12, 2026: The Rest Premium
- Top Trade Ideas for the Week of October 12, 2026: The Best
- SPY Trends and Influencers October 10, 2026
- Macro Week in Review/Preview October 9, 2026
Archives