How About that Real Estate Market: IYR in 3 Time Frames
- Posted by Greg Harmon
- on March 1st, 2011
There are plenty of opinions on the real estate market. You can get them from big time hedge fund managers like Eddie Lampert or Bill Ackman, economists, Case-Shiller or Zillow.com, or even your next door neighbor. Each has an inherent bias in their view so how do you make sense of all of it as a trader or investor? That is easy, just look at the charts. The iShares Dow Jones U.S. Real Estate ETF, IYR, is a good place to look. Let’s look at it in multiple timeframes starting with the daily chart.
Daily

The daily chart for shows that it has been in an upward channel since at least May of 2009, but broke out above it to end the month of February. As it did so the Moving Average Convergence Divergence is crossing higher and the Relative Strength Index (RSI) has bounced off of the the mid line and in steeply heading higher. It has just broken through the upper Bollinger band, so there is some caution for a pullback or sideways consolidation (perhaps a retest of the wedge). The Simple Moving Average’s (SMA’s) are all pointing higher adding to the support for extending the bull case. The price objective on the break out is much higher at 67.72, adding the channel width to the breakout level. So the daily chart it is set up to move higher, what do the longer timeframes suggest?
Weekly
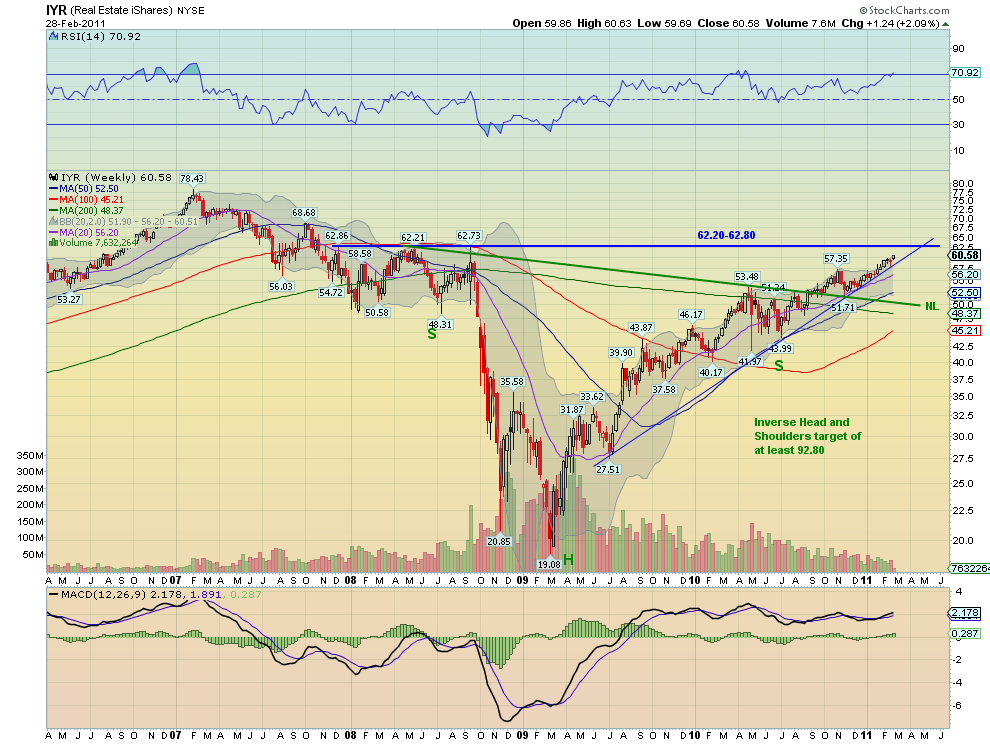
The weekly chart shows some very interesting additional information. The trend is clearly up as shown by the rising thin blue trend line. But notice that it is approaching an area that has been resistance over most of 2008 between 62.20 and 62.80. This area looks to come into play by mid April at the latest as the rising uptrend crosses this level. If it can get through that level then there is also previous resistance at 68.68 and then 72.50 from the 2nd Quarter of 2007 and finally 78.43. The RSI is pointing higher on the weekly chart as well and the MACD is increasing suggesting this timeframe also looks to head higher. One other interesting point to note is that there is an Inverse Head and Shoulders pattern. The neckline has already been tested after the break and held. The target on that pattern is at least 92.80. So the weekly chart is also very positive, what about on a monthly cahrt?
Monthly
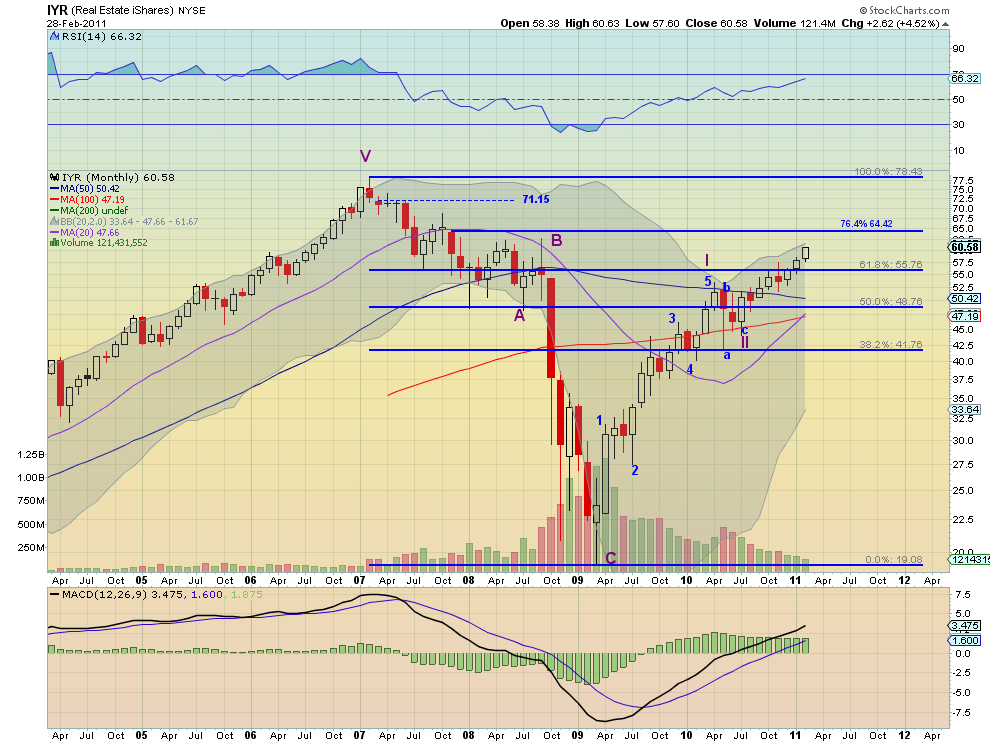
Stepping back to the monthly chart reveals some interesting things going on. First this timeframe is in agreement with the other two that the trend is higher. In fact it appears to be heading in a beeline to the 76.4% retracement level of the down move, which is also previous resistance, at 64.42. The MACD on the monthly timeframe is rather flat, but positive and the RSI is rising to the technically overbought line but far from being extended. The next level of resistance through 64.42 comes at the previous consolidation level at 71.15 and then a a 100% retracement of the down move at 78.43. This last level coincides with a measured move target of 78.39 from looking to a symmetrical move from the bottom up to the peak at 53.48 in April 2010. Finally, turning to Elliott Wave Principle, after a corrective wave from early 2008 through to the March 2009 lows, it is in wave 1 within Super Cycle Wave III, a motive wave higher. Elliott Wave rules would estimate that Wave III would travel to 99.64, 161.8% of the move within Wave I.
So IYR looks good on all timeframes after the recent break out. Could it all fail and end up moving lower? Yes, and then the rising channel can be used as a stop on the daily chart, the trend line on the weekly chart and the 61.8% Fibonacci level on the monthly chart, depending on your timeframe. But for now the trend is higher. Trade’m well.
As always you can see details of individual charts and more on my StockTwits feed and on chartly.)
If you like what you see above sign up for deeper analysis and trading strategy by using the Get Premium button above. As always you can see details of individual charts and more on my StockTwits page.
The information in this blog post represents my own opinions and does not contain a recommendation for any particular security or investment. I or my affiliates may hold positions or other interests in securities mentioned in the Blog, please see my Disclaimer page for my full disclaimer.
blog comments powered by Disqus
-
 Gregory W. Harmon CMT, CFA, has traded since 1986 and held senior positions including Head of Global Trading, Head of Product Development, Head of Strategy and Director of Equity. (More)
 -
Subscribe to Dragonfly Capital Views
Lifetime Subscription
$4,000.00Sign upAnnual Subscription
$1,000.00Sign upQuarterly Subscription
$350.00Sign up
Recent Posts
- Bull Scan for 10-13-26
- Premium Earnings 10-12-26: Citigroup and Johnson & Johnson
- 4 Trade Ideas Wells Fargo: Bonus Idea
- 5 Trade Ideas for Monday: AbbVie, Airbnb, Affirm, GE Aerospace and Walmart
- Top Trade Ideas for the Week of October 12, 2026: The Rest Premium
- Top Trade Ideas for the Week of October 12, 2026: The Best
- SPY Trends and Influencers October 10, 2026
- Macro Week in Review/Preview October 9, 2026
- Bull Scan for 10-12-26
- How this Week’s Premium Top 10 Performed, October 9, 2026
Archives