Google: 3 Resistance Points Before 3 Zeros
- Posted by Greg Harmon
- on October 18th, 2010
Quietly that little Advertising Sales company in California, I mean Technology company, Google (ticker: $GOOG), has brushed off its tiff with China and is back on track. It had a massive move in its stock last week from strong earnings and a good forecast. A gap up of 10%. As I write this Google is trading at 611 and seems to be resting. A well deserved rest given its move and what you would expect right? Look at that daily chart below.
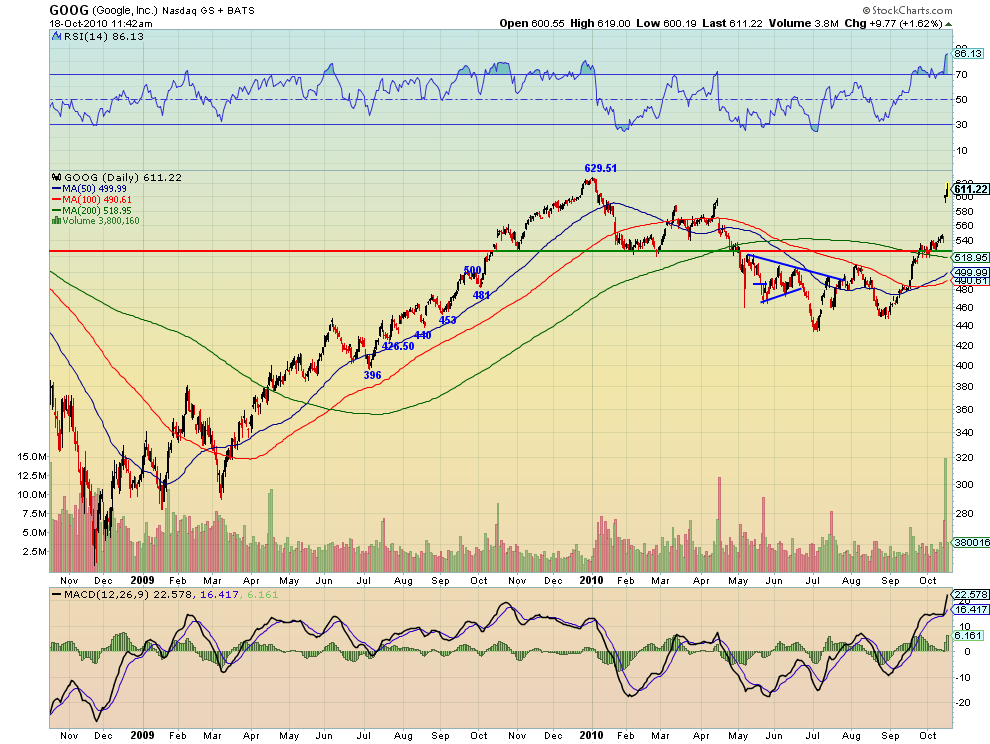
Through $650 My Target is $1000
There it is, I said it. I am not just trying to shake things up while you sit on your hands waiting for Apple Earnings. Here is the analysis. There are only three key resistance points in its way to having a $1000 target on its back. Yes that is $1000 with 3 zeros. First note on that daily chart the high of 629.51 near the beginning of the year. That is the first resistance point. Now shift your eyes to the weekly chart below.

A weekly close above the 644 – 650 area would create a massive inverse Head and shoulders formation. There is a range because of the slight positive slope to the neckline. Notice that the top of the head is at 247 and the neckline there is at about 612 making for a $365 difference. This creates a target upon a break of the neckline higher of at least $999 if it were to happen this week. That leaves only the past high of 747.24 as the last resistance in the way of a $1000 target.
So expensive stock, or time to think about getting in?
If you like what you see above sign up for deeper analysis and trading strategy by using the Get Premium button above. As always you can see details of individual charts and more on my StockTwits page.
The information in this blog post represents my own opinions and does not contain a recommendation for any particular security or investment. I or my affiliates may hold positions or other interests in securities mentioned in the Blog, please see my Disclaimer page for my full disclaimer.
blog comments powered by Disqus
-
 Gregory W. Harmon CMT, CFA, has traded since 1986 and held senior positions including Head of Global Trading, Head of Product Development, Head of Strategy and Director of Equity. (More)
 -
Subscribe to Dragonfly Capital Views
Lifetime Subscription
$4,000.00Sign upAnnual Subscription
$1,000.00Sign upQuarterly Subscription
$350.00Sign up
Recent Posts
- Bull Scan for 10-14-26
- Premium Earnings 10-13-26: Fastenal and Morgan Stanley
- Bull Scan for 10-13-26
- Premium Earnings 10-12-26: Citigroup and Johnson & Johnson
- 4 Trade Ideas Wells Fargo: Bonus Idea
- 5 Trade Ideas for Monday: AbbVie, Airbnb, Affirm, GE Aerospace and Walmart
- Top Trade Ideas for the Week of October 12, 2026: The Rest Premium
- Top Trade Ideas for the Week of October 12, 2026: The Best
- SPY Trends and Influencers October 10, 2026
- Macro Week in Review/Preview October 9, 2026
Archives