From the Charts: Macro Week in Review/Preview October 2, 2010
- Posted by Greg Harmon
- on October 2nd, 2010
Last week’s review of the macro market indicators for the week looked to bring stronger prices for Gold again and more flogging of the US Dollar Index. US Treasury Bonds have been changing direction with changes in sentiment and Oil looked to be stagnating. The relatively low and stable volatility index combined with that weaker dollar seemed to be creating a fertile environment for stocks to continue higher. Treasuries and Oil started the week heading higher and lower respectively, while Gold, the US Dollar Index and equities behaved as expected. Then came September Quarter end. Oil which started to move Wednesday rocketed higher, the S&P 500 blasted through 1150 for about a nanosecond before settling into the recent range again with Treasuries doing the same in the opposite direction. How will this impact the coming week? Let’s look at the charts.
Gold Daily
Gold Weekly

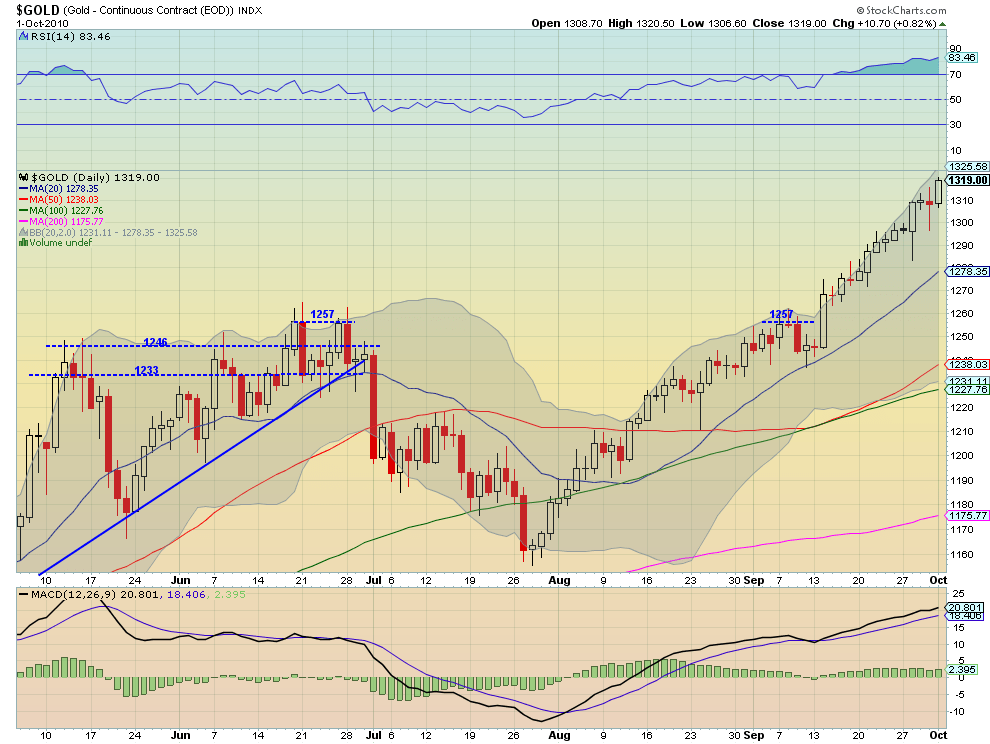
Gold continues to run higher and looks like it has more to go. A test of 1325-1350 area seems likely from several measures. Taking the move from1160 to the pause at 1255 and adding it to 1255 gets it to a target of 1350. The Inverse Head and Shoulders pattern illustrated in the weekly chart also has a target of at least 1325. Finally the channel internal resistance line is now at 1348. If it gets through this convergence of resistance the next target would be 1390. The Moving Average Convergence Divergence (MACD) indicator looks good on both charts. The Relative Strength Index (RSI) is getting very high on the daily chart and starting t reach the overbought range on the weekly chart now too, so it may pause for a while. There is now support at 1310 followed by 1300 and then 1278 on the daily chart, and lower at 1255 and 1230 on the weekly. (wkly) – Looks to test 1348 with resist at 1390 higher, supp at 1255 then 1230
West Texas Intermediate Crude Daily
West Texas Intermediate Crude Weekly

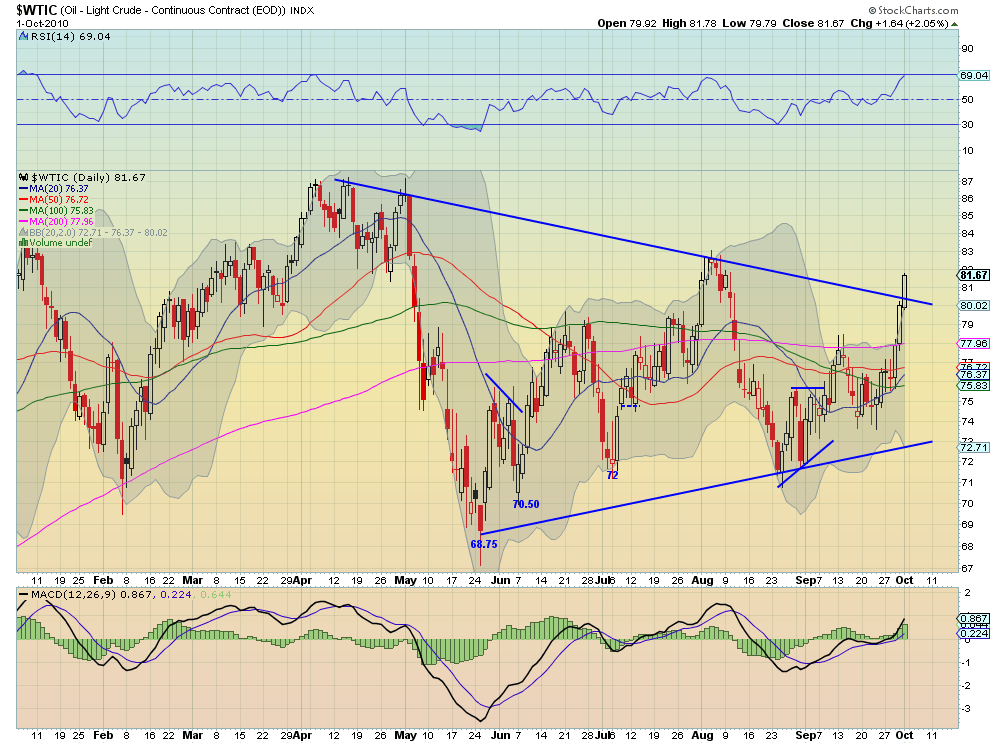
Crude Oil broke out of a four month symmetrical triangle this week finishing the week with a bullish Three Advancing White Soldiers pattern on the daily chart. This signals higher prices to come. It now sees resistance at 83 and then 86. The target for the triangle break would be near 97. Moving to the weekly chart oil broke the recent high at 81 with a next resistance of 84 and then 87. Above 87 could be viewed as a broad 70-87 channel break and would signal a target near 115. There is support at 80.2, a retest of the triangle on the daily, and then 77.96, the 200 day Simple Moving Average (SMA), if it fails. The RSI is rising on both the daily and weekly charts. This and the MACD increasing on the daily and flat on the weekly support a move higher as well.
US Dollar Index Daily

US Dollar Index Weekly
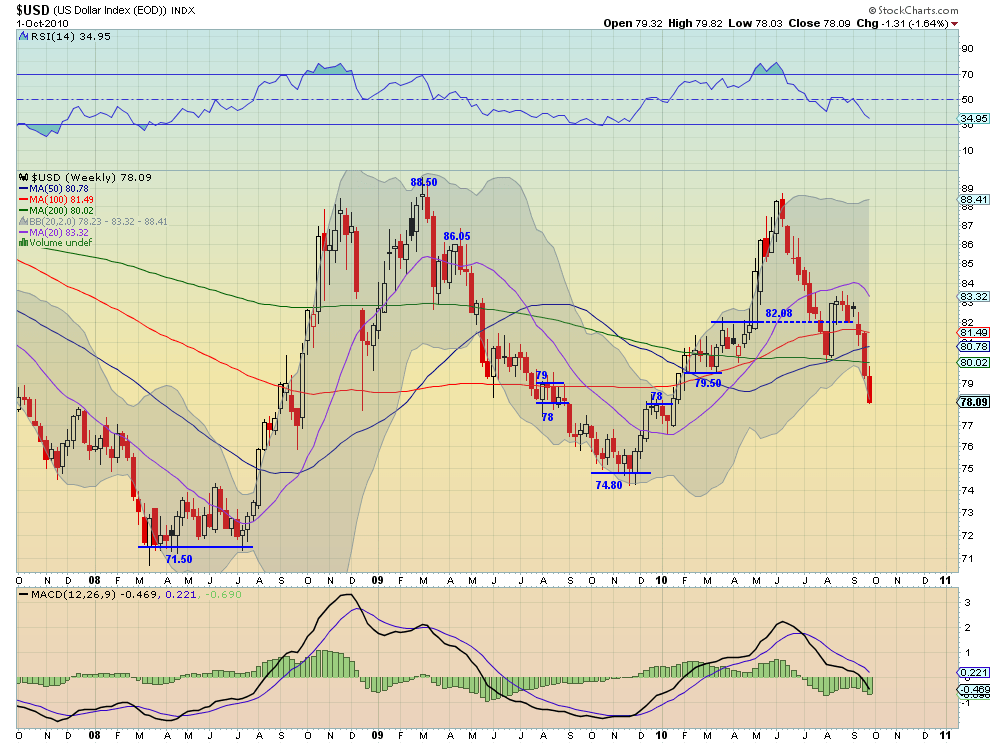
The US Dollar Index continued to get crushed this week and despite the Morning Star doji on the daily chart Friday, still looks weak. There is support at 78 and then 77.35 and 76.75 on the daily chart, and resistance at 79 then 79.50. The weakness is most pronounced in the weekly chart. Support shows up at 74.8 followed by 71.50, which would complete an M pattern. The MACD is increasing to the downside on the weekly and the RSI has some room before being oversold. The one indicator to watch that shows a potential to stall the fall is the weekly Bollinger Band, which the price is piercing now.
iShares Barclays 20+ Yr Treasury Bond Fund Daily
iShares Barclays 20+ Yr Treasury Bond Fund Weekly

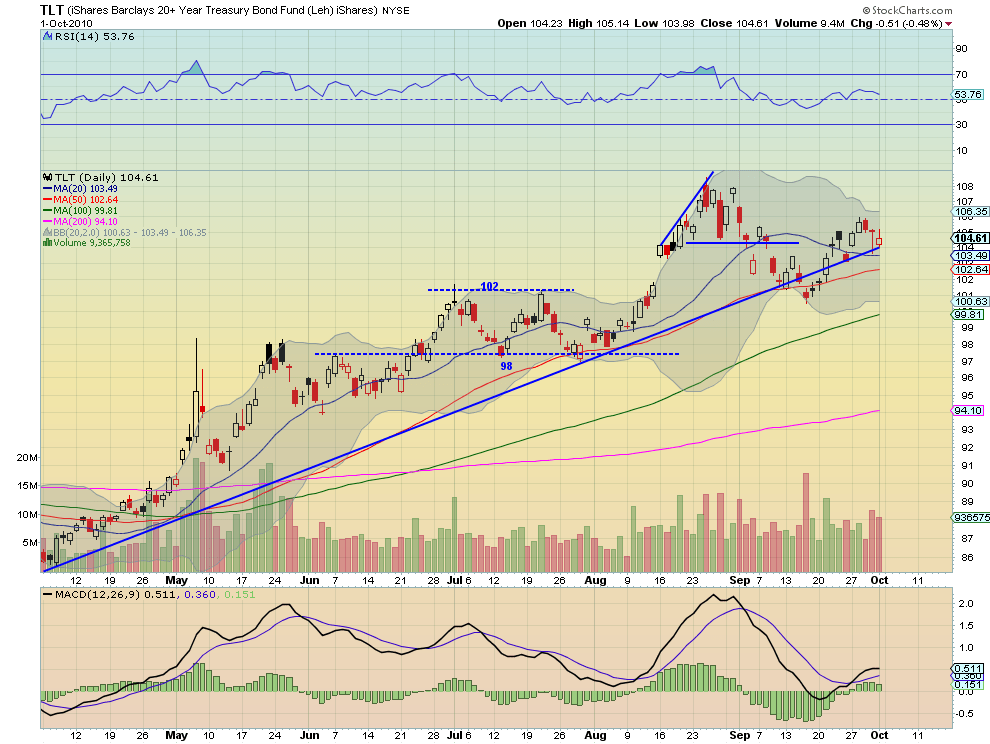
US Treasuries, measured by the TLT, are holding the up trendline support at 104 with support lower at 103.49 and then 102.64. There is resistance at 106 followed by 107 on the daily chart. The shorter SMA’s have been flattening out, as has the RSI and MACD, creating a bottom bound. the weekly chart is a bit bullish, just slightly, having continued the rise after filling the gap three weeks ago. Resistance comes at 106 followed by 108.5 and then 115.
VIX Daily

VIX Weekly
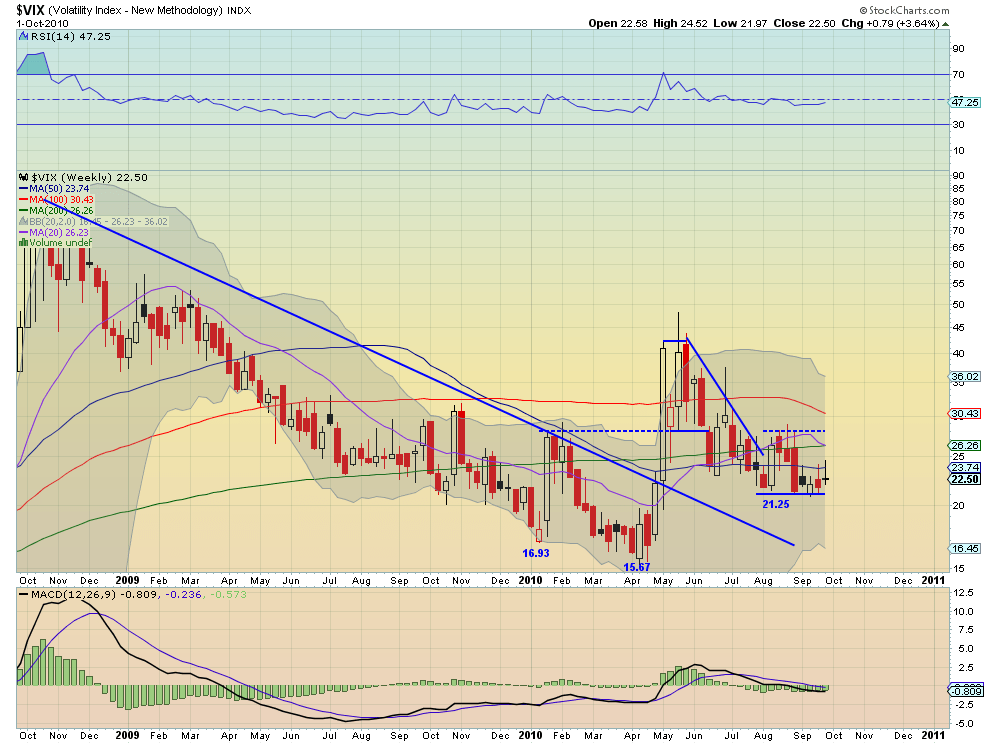
The Volatility Index is still in the 21.25 – 28.40 range, with upside resistance at a flat-lined 200 SMA of 23.62. The weekly chart is just as boring. Nothing to see here, move along.
SPY 60 minute
SPY Daily
SPY Weekly
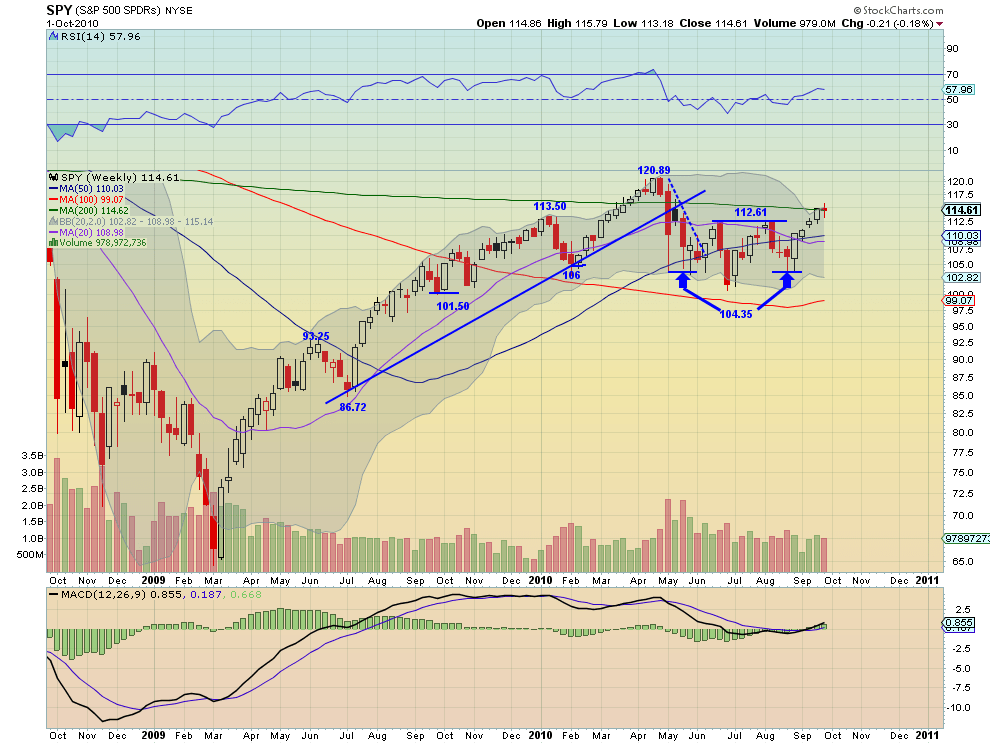
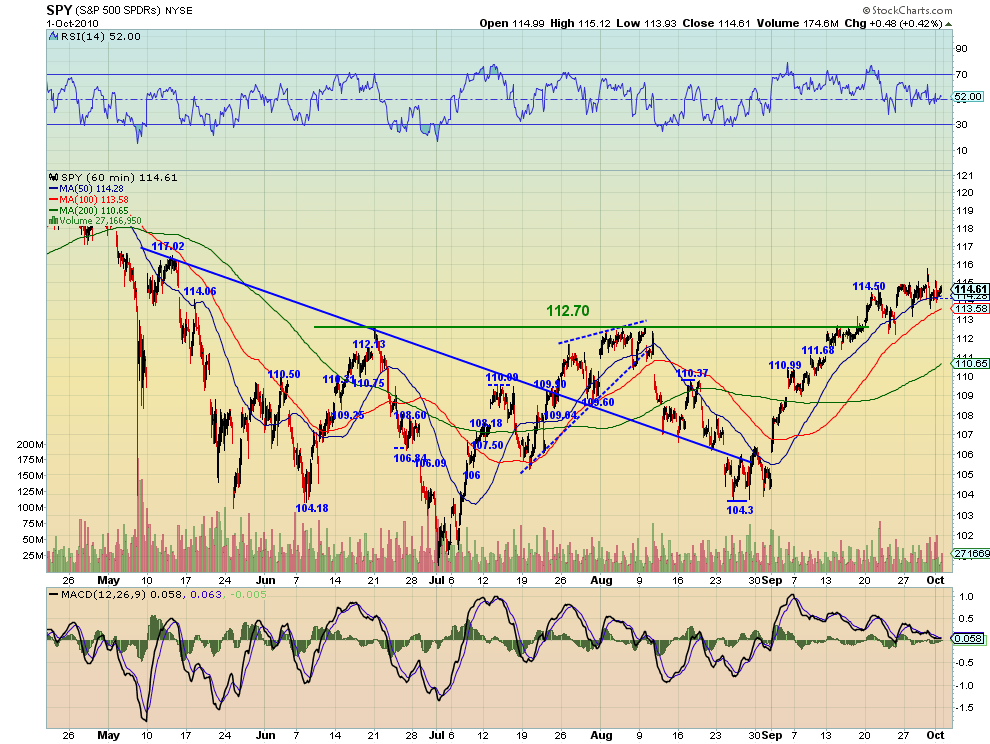
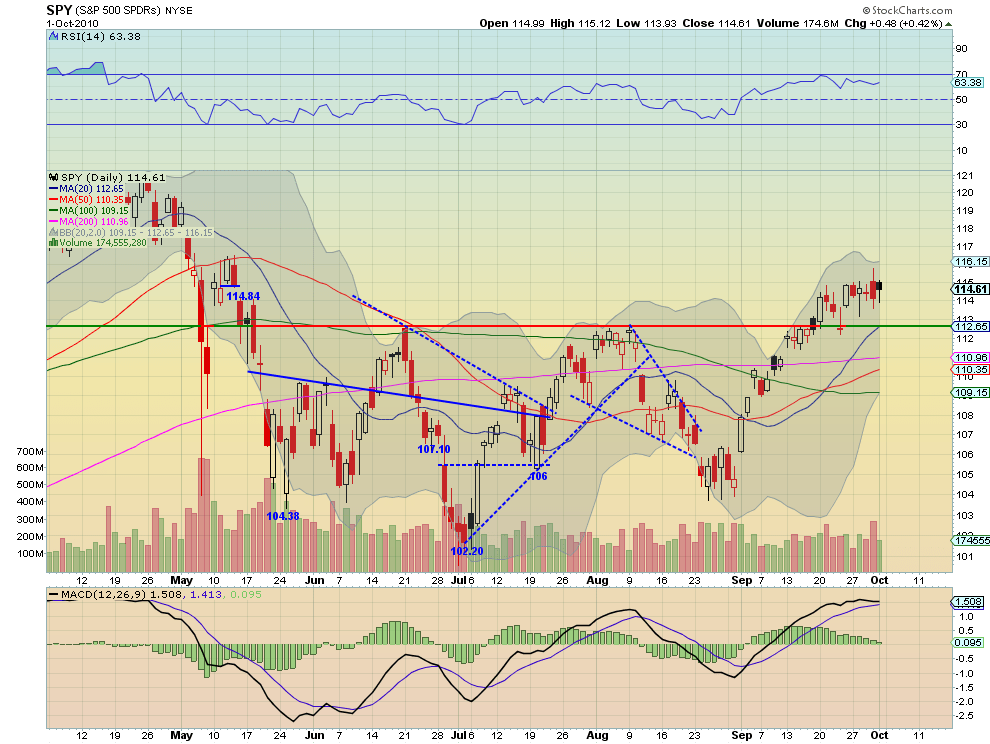
The SPY has shown 115 to be real resistance the past week, when looking at the hourly chart, with support coming by way of the 50 hour SMA, now at 114.28. The daily chart shows the same consolidation around 114-115. Resistance is found at 116.50 and 117 with support lower at 112.61-.65. The MACD is decreasing and close to flat and crossing which could indicate a fall. The weekly chart shows a doji star right at the 200 week SMA ,114.62. If it can get through that then resistance from the weekly chart comes at 117.5 and 120.89 higher, and support at 112.61 then 110.03. Confusing matters further, the MACD on the weekly chart is starting to rise.
IWM Daily
IWM Weekly
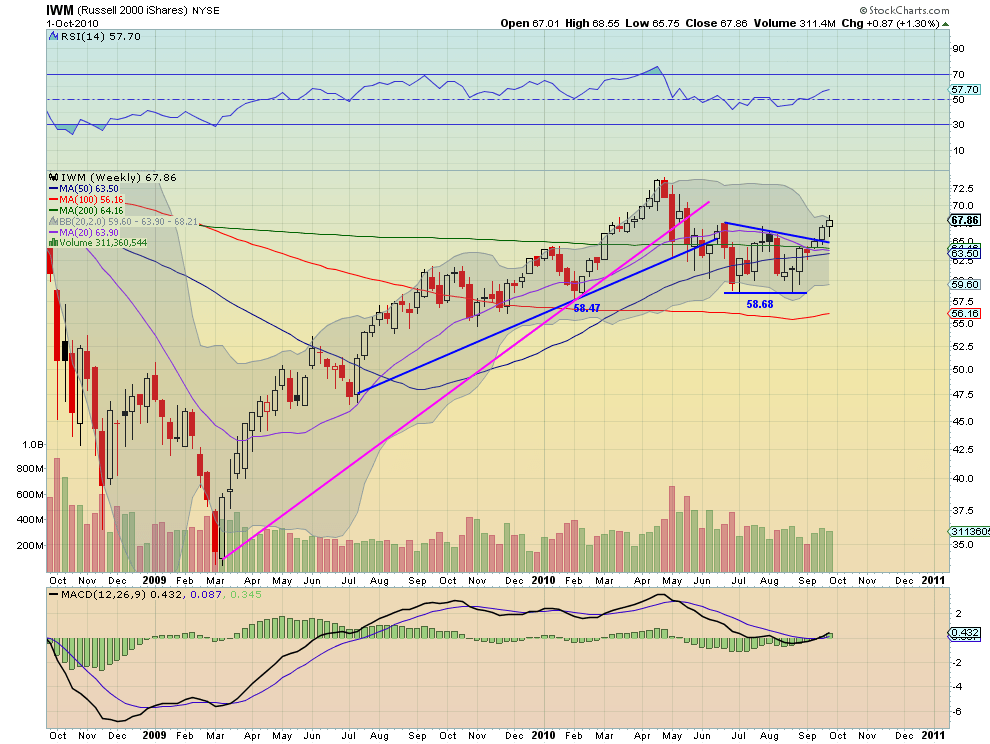
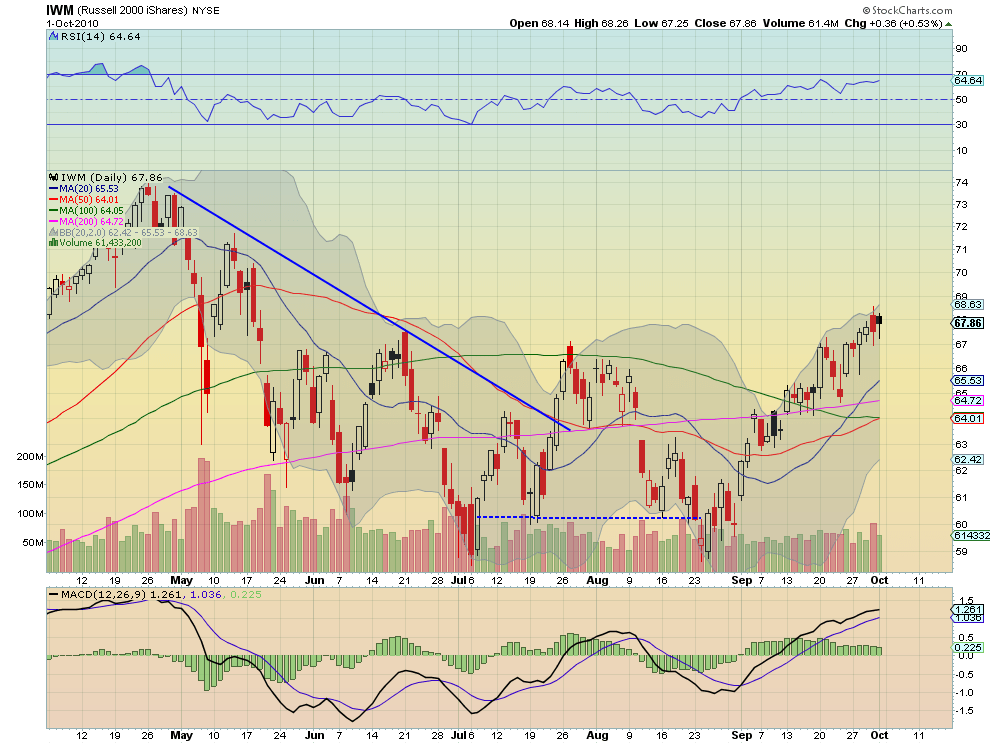
The IWM has been the strongest of the Index ETF’s the past week but looks to need a rest at 67.50. Resistance higher is at 70, and support can be found at 67 then 66 on the daily chart. The recent up trend is still in tact, with rising 20 and 50 day SMA’s adding support. IWM looks more bullish on the weekly chat as it has broken above the recent consolidation area and is being aided by a MACD cross. Resistance on the weekly comes at 74.5 with support at 65 and then the63.5-64.16 area.
QQQQ Daily

QQQQ Weekly
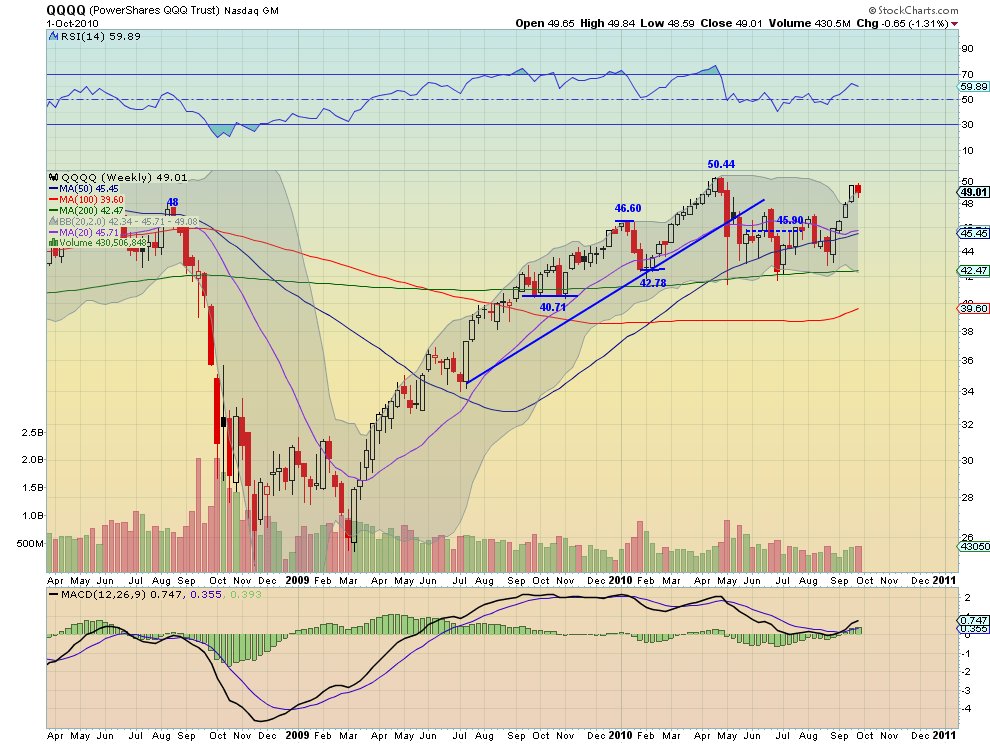
The Q’s are also consolidating, in a range between 49-50 and working off an overbought RSI. Resistance comes above the consolidation area at 50.4, and support below at 48.30. The MACD is weakening on the Q’s as well and about to cross on the daily but with the same divergence as in the SPY with the weekly MACD rising. The trend is still up but getting a bit tired.
So next week looks to bring stronger prices for Gold and Oil with the US Dollar Index still broken and on a path lower. US Treasury Bonds are moving higher but more sideways and need a catalyst to move. The Volatility index appears tame for the time being. Equity markets seem a bit tired in shorter timeframes but more positive in the longer timeframes, so do not be surprised if there is a small pullback. Good luck next week!
If you like what you see above sign up for deeper analysis and trading strategy by using the Get Premium button above. As always you can see details of individual charts and more on my StockTwits page.
The information in this blog post represents my own opinions and does not contain a recommendation for any particular security or investment. I or my affiliates may hold positions or other interests in securities mentioned in the Blog, please see my Disclaimer page for my full disclaimer.
blog comments powered by Disqus
-
 Gregory W. Harmon CMT, CFA, has traded since 1986 and held senior positions including Head of Global Trading, Head of Product Development, Head of Strategy and Director of Equity. (More)
 -
Subscribe to Dragonfly Capital Views
Lifetime Subscription
$4,000.00Sign upAnnual Subscription
$1,000.00Sign upQuarterly Subscription
$350.00Sign up
Recent Posts
- Bull Scan for 10-14-26
- Premium Earnings 10-13-26: Fastenal and Morgan Stanley
- Bull Scan for 10-13-26
- Premium Earnings 10-12-26: Citigroup and Johnson & Johnson
- 4 Trade Ideas Wells Fargo: Bonus Idea
- 5 Trade Ideas for Monday: AbbVie, Airbnb, Affirm, GE Aerospace and Walmart
- Top Trade Ideas for the Week of October 12, 2026: The Rest Premium
- Top Trade Ideas for the Week of October 12, 2026: The Best
- SPY Trends and Influencers October 10, 2026
- Macro Week in Review/Preview October 9, 2026
Archives