From the Charts: Macro Week in Review/Preview October 16, 2010
- Posted by Greg Harmon
- on October 17th, 2010
Last week’s review of the macro market indicators for the week looked for stronger prices for Gold and Crude Oil with the US Dollar Index weak and looking lower. Bonds look to continue their drift higher until some catalyst sparks a move. The Volatility Index is breaking its channel lower adding to the bullish case for the equity Index ETF’s. The Equity Index ETF’s for the second week in a row look positive but stronger on a weekly time-frame than on the daily charts, so a pullback could occur on the way higher. The week started with Gold and Oil resting, and the US Dollar Index retracing slightly. Bonds, measured by the TLT, and the Equity Index ETF’s were treading water. Bonds then started a move lower on Tuesday with equities starting higher. This continued Wednesday with Gold and Oil both waking up and the Dollar Index resuming lower. Bond selling continued Thursday, and equities came off of their highs slightly. Friday saw some position squaring and profit taking but a good run up from the NASDAQ 100 ETF What will the week ahead bring? Let’s look at the charts.
(As always you can see these individual charts and more on my twitter feed and on chartly.)
Gold Daily
Gold Weekly

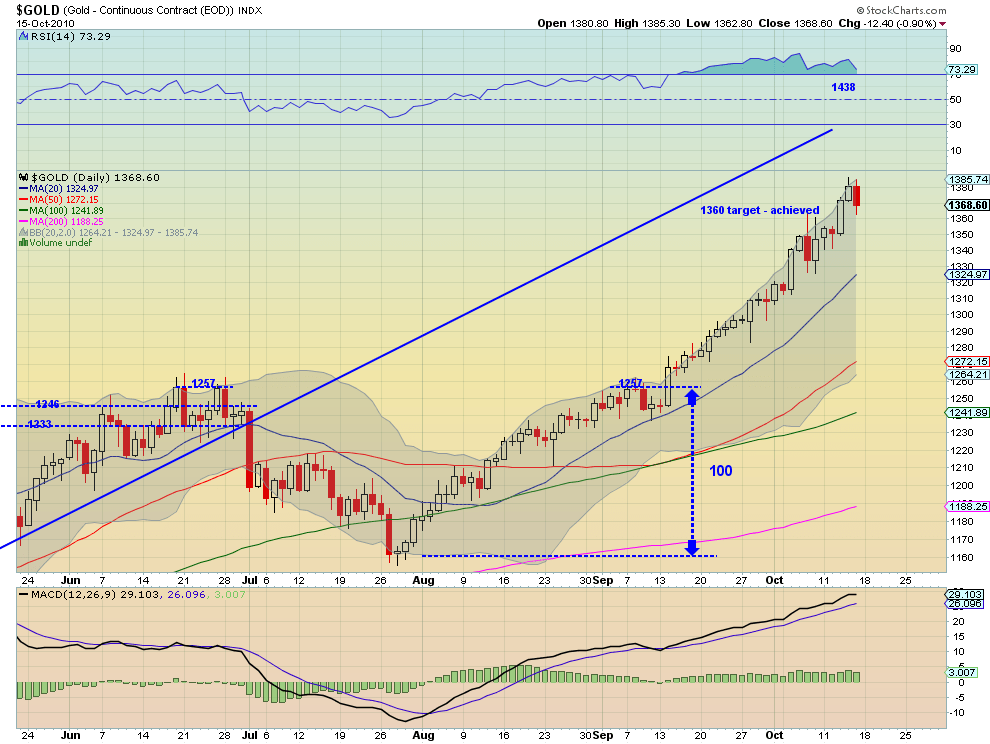
After another impressive weekly for Gold, the metal sold off slightly Friday, signaling some resistance at the 1380 level. Above that there is resistance at 1400 and then 1438 on the daily chart. The trend remains higher and Friday’s action allowed it to work off some of the slightly overbought Relative Strength index (RSI). The weekly chart shows a break through the mid line of the up channel. The last time it did this it went on to hit the top which would be resistance at 1448. Support comes at the mid line of the weekly chart at 1362 then 1352 and 1330 on the daily chart. Expect higher prices.
West Texas Intermediate Crude Daily
West Texas Intermediate Crude Weekly

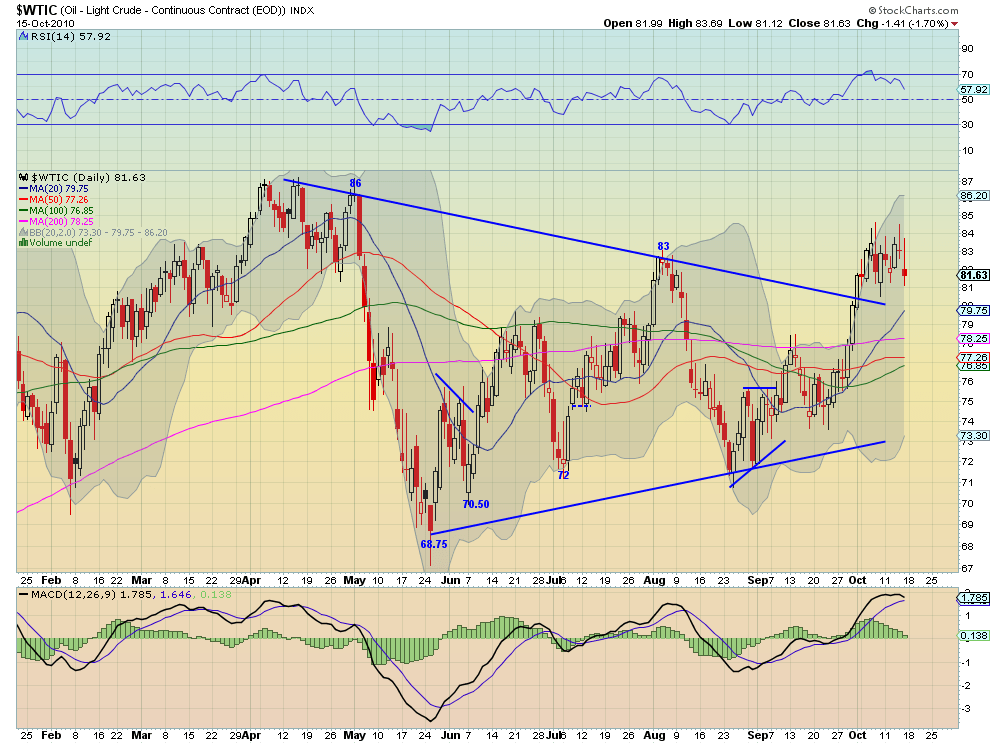
Oil has been in a flag on the daily chart since breaking out of the symmetrical triangle 2 weeks ago, with resistance at 83 and support near 81.60. Support lower on the weekly chart comes at the 81 level, followed by triangle near 80 and then 79.75 from the daily chart. Resistance on the weekly is at 84 and then 87 with the daily chart showing resistance at 86. The RSI is looking lower on the daily and the Moving Average Convergence Divergence (MACD) indicator is waning to zero and about to cross. This may test lower in the short term. If it does there is good support from the clustered Simple Moving Averages (SMA’s) between76.85 and 77.27 from both the daily and weekly charts.
US Dollar Index Daily
US Dollar Index Weekly

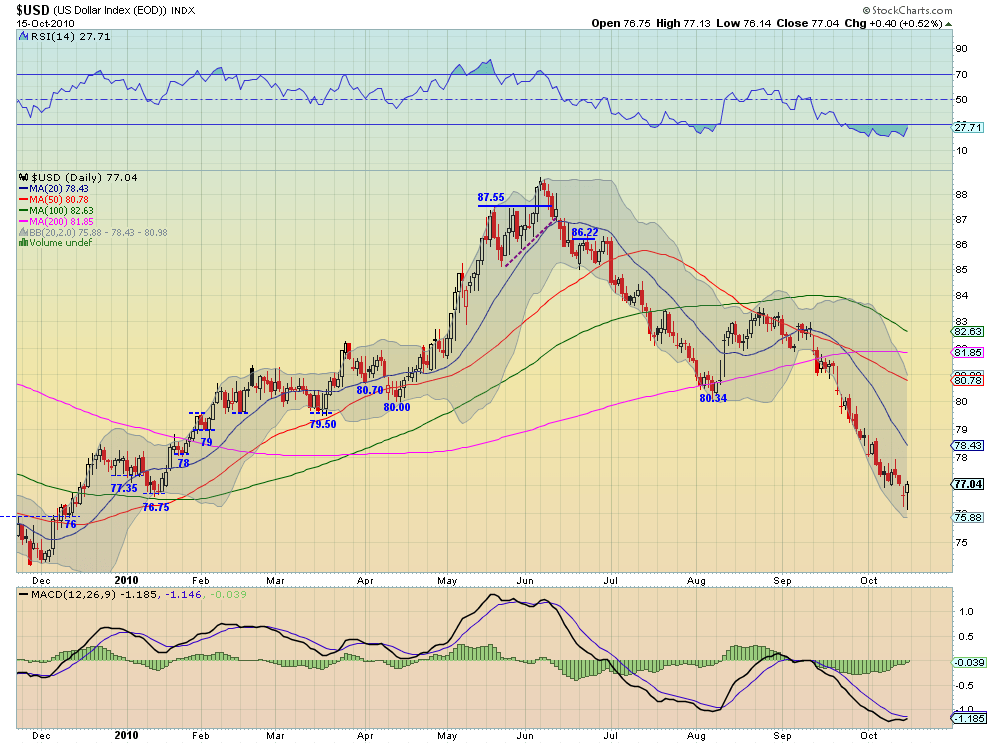
The US Dollar Index ended the week on a positive note with a hammer candle on the daily chart. The MACD is curling up and about to cross and RSI is working off being oversold, but the trend remains down. 76.75 is support on the daily chart with 76 below that, and resistance at 77.35 followed by 78. Perhaps a bit of a bounce to come? The weekly chart printed a long legged doji, signaling indecision, right on top of the 77 support level. The momentum indicators are more negative on the weekly with the MACD growing more negative and the RSI not yet oversold.
iShares Barclays 20+ Yr Treasury Bond Fund Daily
iShares Barclays 20+ Yr Treasury Bond Fund Weekly
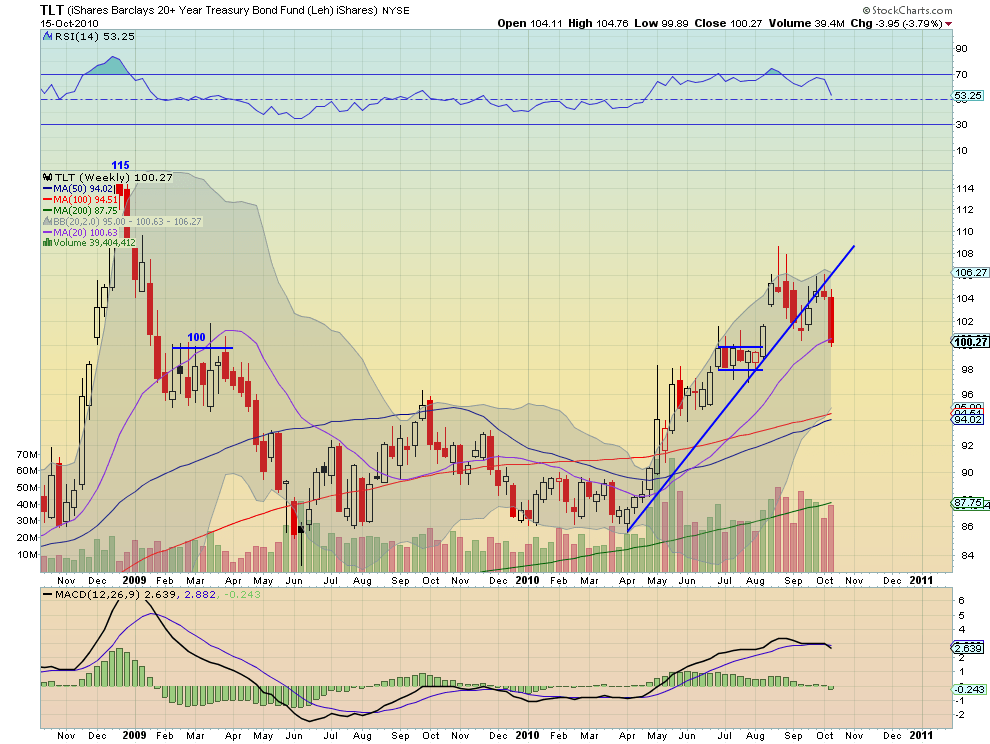
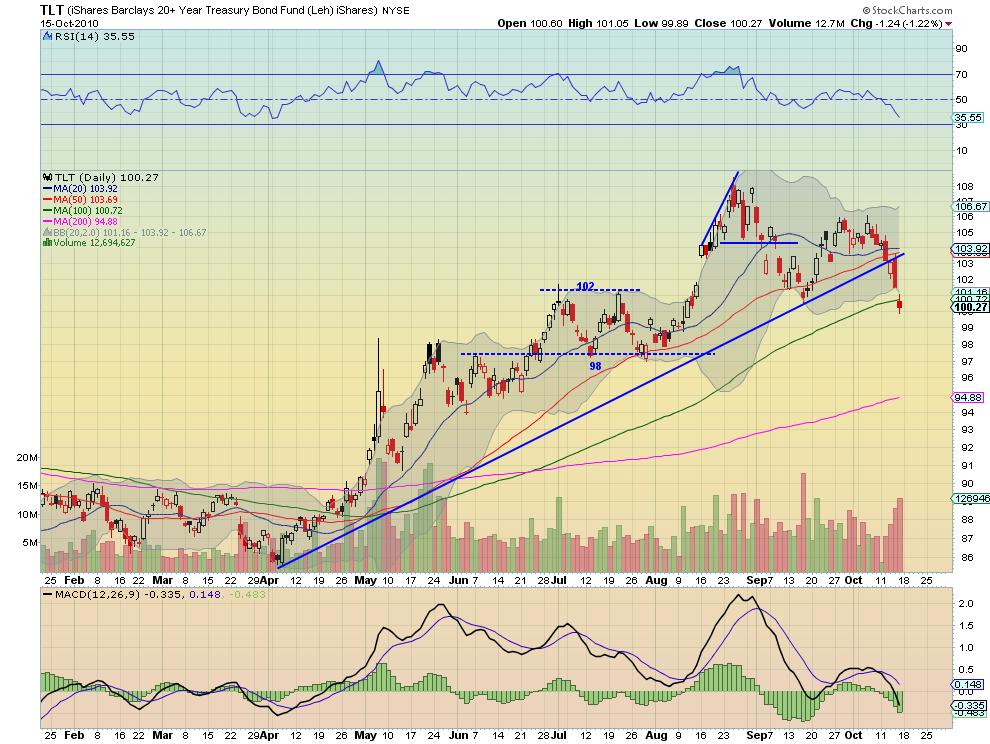
US Treasuries, as measured by the iShares Barclays 20+ Yr Treasury Bond Fund, TLT, broke the uptrend solidly this week and look to be going even lower. On the daily chart the trend line was broken Wednesday and confirmed Thursday. Friday did print outside of the Bollinger Bands so there may be a short term return there, but the rising volume on the sell off and the MACD and RSI are all supporting further downside. The weekly chart shows that it lost the 20 week SMA but has had some support at the 98-100 channel in the past. Below that 98 from the daily chart and 94.51 from the weekly are support. The MACD on the weekly is just crossing and the RSI looks to be running lower. Expect it to continue lower.
VIX Daily

VIX Weekly
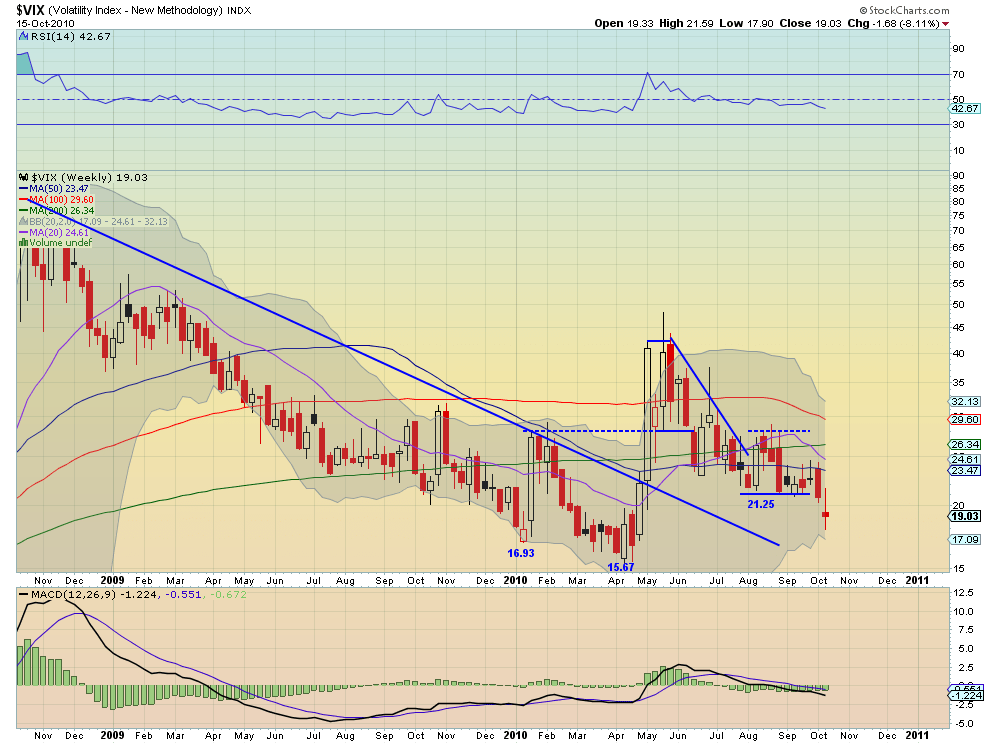
After breaking the long channel to the downside last Friday the Volatility Index could not retake the channel. There is support at 18 and then 16 from the daily chart and 16.93 from the weekly. 21.25 is the key level to watch, but expect more sideways drift.
SPY 60 minute
SPY Daily
SPY Weekly
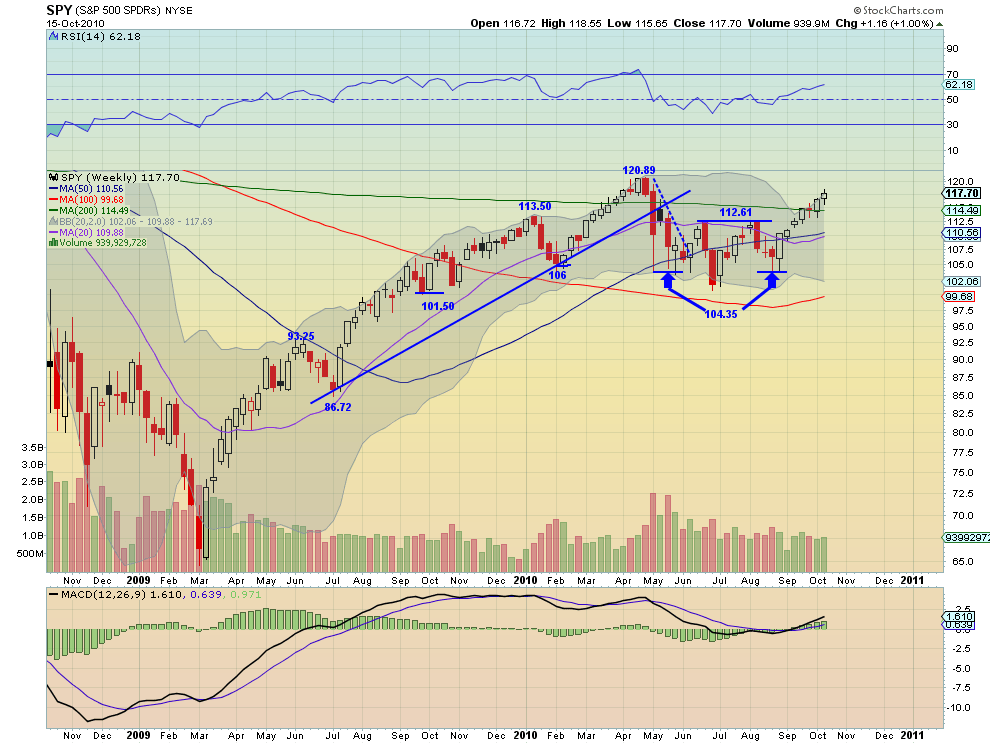
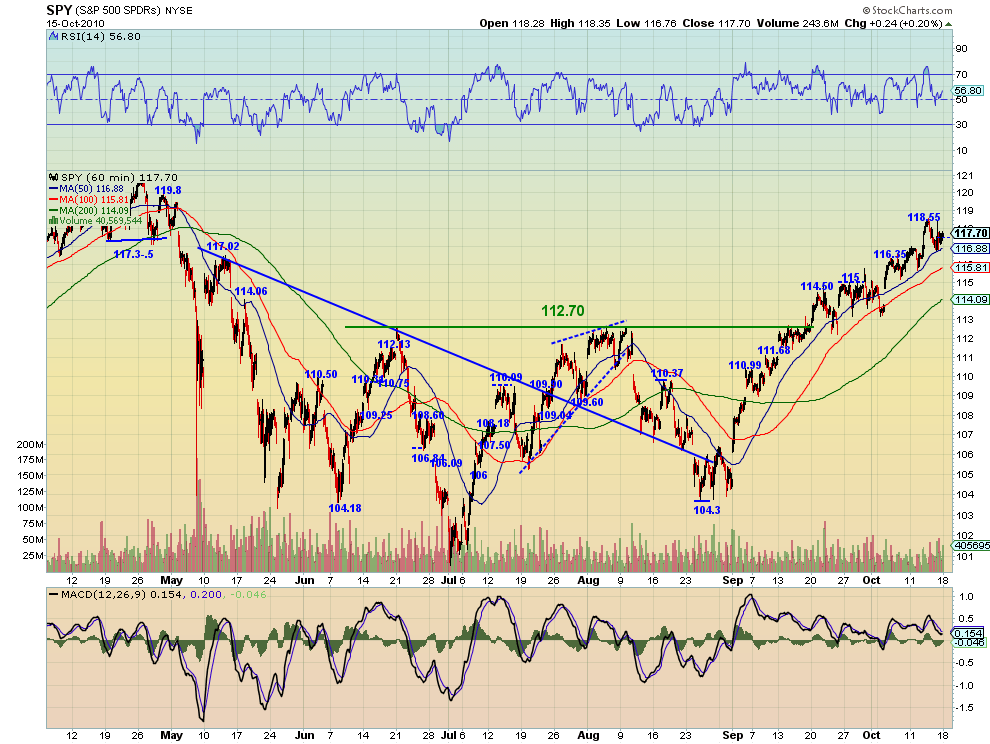
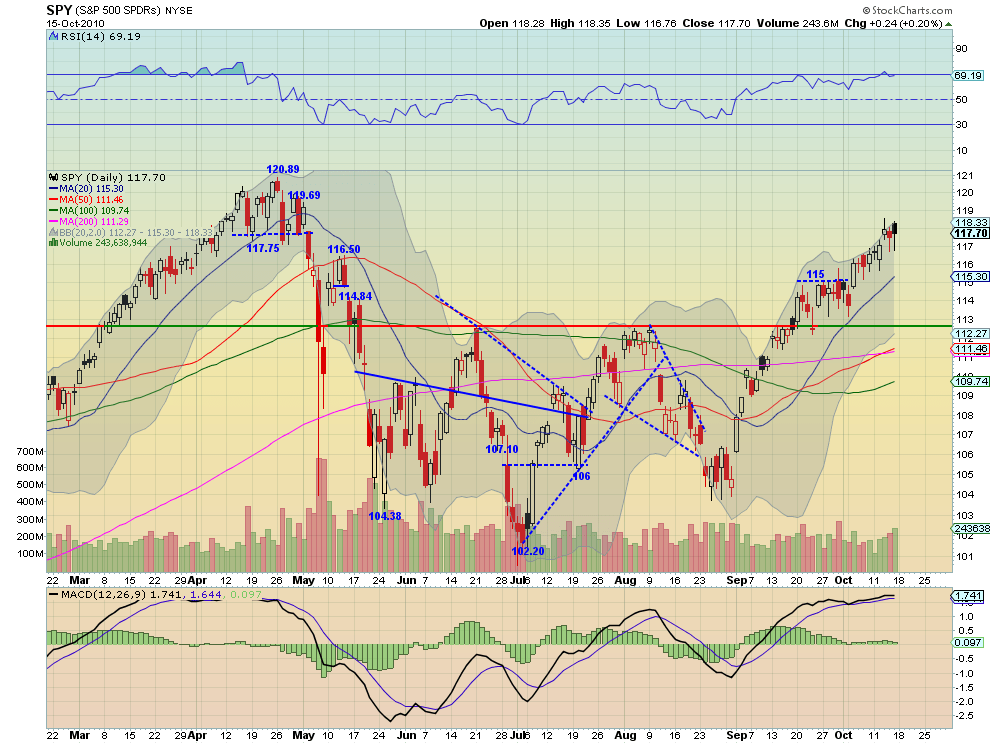
The hourly chart on the SPY shows a nice stair step up pattern with slight pullbacks along the way to get out of overbought ranges. All of the hourly SMA’s are rising and parallel. The daily chart smooths this rise and shows it near the 117.75 support/resistance area from April. Higher there is resistance at 119.69 and then 120.89. Support comes lower at 117 followed by 116.50 and 115-115.30 on the daily chart. The weekly chart shows a continued rise above and away form the 200 week SMA with an increasing MACD indicator and a rising RSI, both positive going forward. Also note that the weekly SMA’s are all curling up. I like it higher.
IWM Daily
IWM Weekly
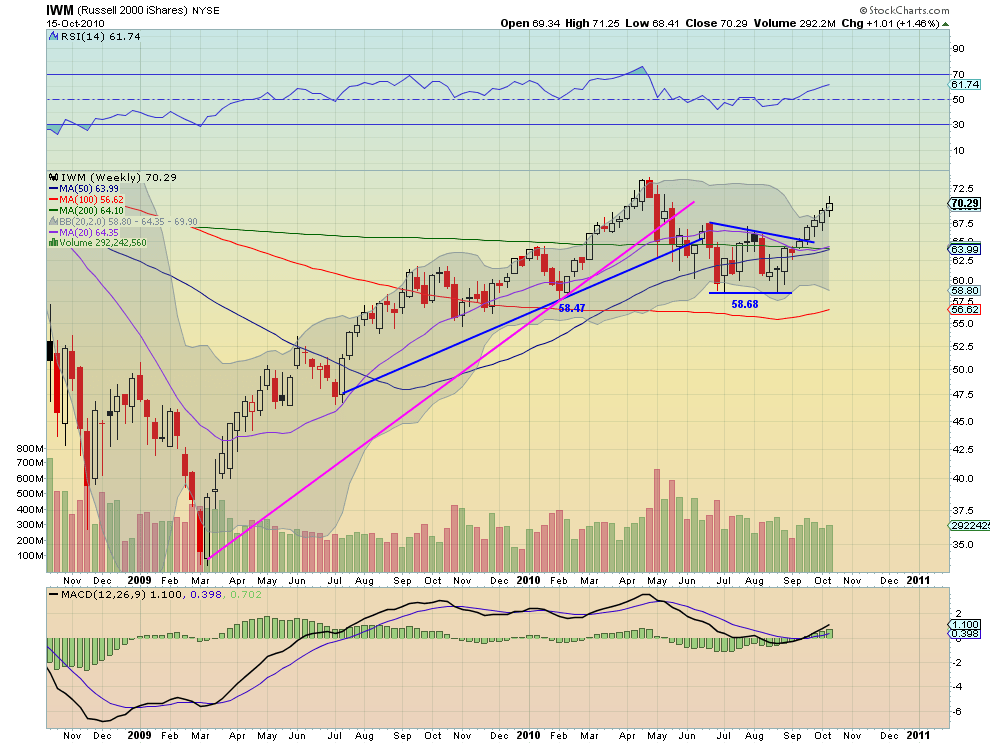
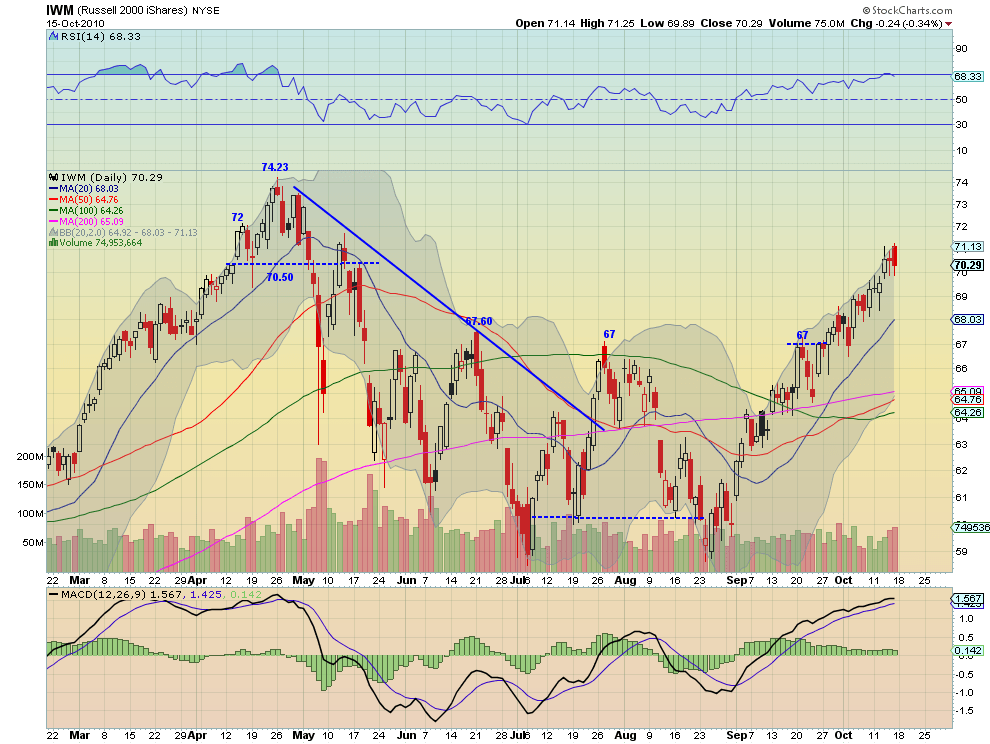
IWM printed a bearish outside reversal candle on Friday, so beware of a possible pullback, in this up trend. It did hold above the 70 support level though with 68.03 lower on the daily chart. This candle did allow it to work off the overbought RSI. Resistance higher is at 72 then 74.23. Moving to the weekly chart IWM looks great to go higher. Everything looks good. The 20, 50 week SMA’s are crossing higher through the 200 week SMA. The MACD is increasing and the RSI is rising. Where the daily chart shows some potential weakness the weekly chart says expect it to be short if it happens.
QQQQ Daily
QQQQ Weekly

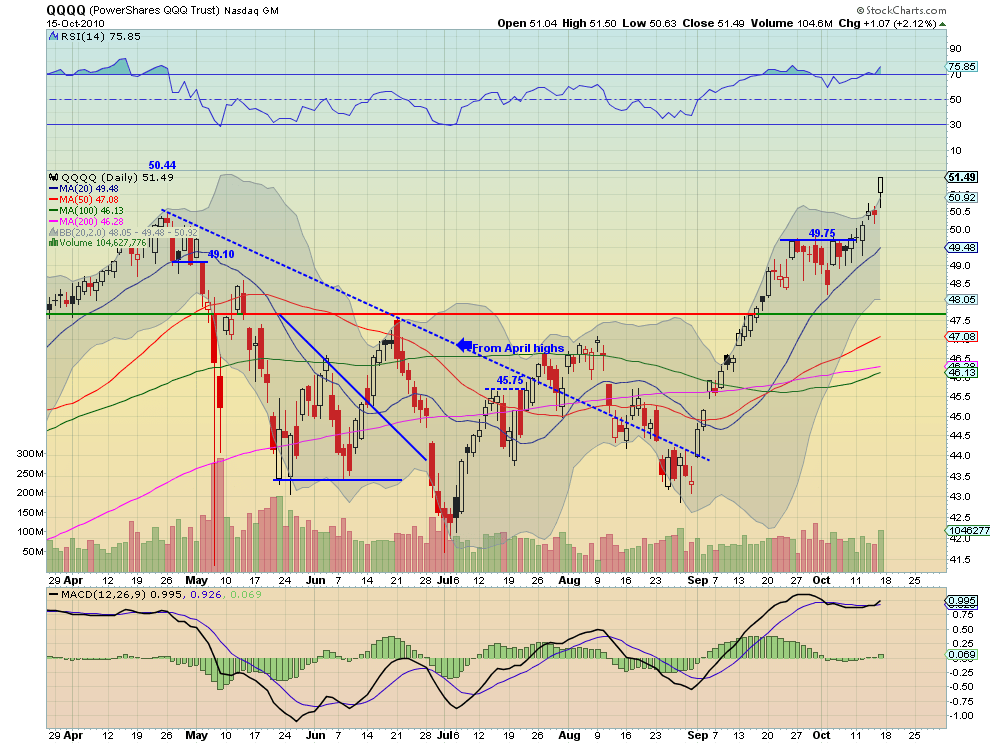
The QQQQ had a great week capped by a superb run Friday. It is now at levels not seen since it hit 52.11 in November 2008. That is the next resistance higher. Like the SPY and IWM there are a few short term troubling indicators. It is slightly overbought on the RSI and is above the Bollinger band on the daily chart. But all of the daily SMA’s are rising with the 100 day SMA about to cross higher through the 200 day SMA. Support lower comes at 50 and then 49.75. The weekly chart looks good for more. It moved higher out of the bull flag this week, but slightly above the upper Bollinger band. The MACD is increasing and the RSI is rising. Resistance higher from the weekly comes at 52 and then 54, with support at 50.44 and 50.
So next week looks to bring stronger prices for Gold, but may see a slight pullback in Oil. The US Dollar Index is still weak but may see a quick bounce and US Treasuries look to continue lower. The Volatility Index should continue to be relatively benign, but equities again look weaker in the daily charts and may see a rest or quick pullback but the weekly charts still all point higher. Good luck next week!
If you like what you see above sign up for deeper analysis and trading strategy by using the Get Premium button above. As always you can see details of individual charts and more on my StockTwits page.
The information in this blog post represents my own opinions and does not contain a recommendation for any particular security or investment. I or my affiliates may hold positions or other interests in securities mentioned in the Blog, please see my Disclaimer page for my full disclaimer.
blog comments powered by Disqus
-
 Gregory W. Harmon CMT, CFA, has traded since 1986 and held senior positions including Head of Global Trading, Head of Product Development, Head of Strategy and Director of Equity. (More)
 -
Subscribe to Dragonfly Capital Views
Lifetime Subscription
$4,000.00Sign upAnnual Subscription
$1,000.00Sign upQuarterly Subscription
$350.00Sign up
Recent Posts
- Bull Scan for 10-14-26
- Premium Earnings 10-13-26: Fastenal and Morgan Stanley
- Bull Scan for 10-13-26
- Premium Earnings 10-12-26: Citigroup and Johnson & Johnson
- 4 Trade Ideas Wells Fargo: Bonus Idea
- 5 Trade Ideas for Monday: AbbVie, Airbnb, Affirm, GE Aerospace and Walmart
- Top Trade Ideas for the Week of October 12, 2026: The Rest Premium
- Top Trade Ideas for the Week of October 12, 2026: The Best
- SPY Trends and Influencers October 10, 2026
- Macro Week in Review/Preview October 9, 2026
Archives