From the Charts: Macro Week in Review/Preview November 12, 2010
- Posted by Greg Harmon
- on November 12th, 2010
Last week’s review of the macro market indicators for the week looked to bring stronger prices for Gold and Oil and further weakness for the US Dollar Index and US Treasury Bonds. This was expected to aid emerging market stock prices. Volatility looked to remain relatively low and stable giving a supportive environment for equity prices to continue their rise.
The week started and, well, Oil did go up and US Treasury Bonds continued their fall. Gold started to make a flag above the prior week’s level. As far as everything else is concerned, the US Dollar Index however climbed up off of the mat after an eight count (Burgess Meridith wold be proud!) and has been working higher. With US Dollar strength, equities started to stall and move lower. Then rumors about China (raising rates) and Ireland (being bailed out) threw some volatility into the mix on Friday. Let’s look at the charts.
(As always you can see these individual charts and more on my twitter feed and on chartly.)
Gold Daily

Gold Weekly

Gold started the week off right where it left off last week and then stalled in a wide flag. After a major sell off on Friday testing the 20 day Simple Moving Average (SMA) at 1361.83, it recovered some to close at 1368.90, $8 above the low. Support from the daily chart below below the 20 day SMA comes at 1340 and then 1320. It certainly looks like it can go lower with a falling Relative Strength Index (RSI) that has not yet touched the 50 mid-line, and a Moving Average Convergence Divergence (MACD) indicator that is waning and about to cross. It is still in an uptrend though which can readily be seen in the weekly chart. This chart shows that Gold broke the mid-line of the rising channel but has to fall through support at 1330 and the 200 week SMA at 1270.99 before it tests the channel wall. The MACD and RSI are more positive on the weekly timeframe as well. Resistance higher can be found at the April high area near 1387 then 1414, the top of the flag before new high s would see resistance at 1438.
West Texas Intermediate Crude Daily

West Texas Intermediate Crude Weekly

The daily chart for Crude Oil looks like the flight path of a bird into a window. It flies right at it (the resistance at 88.50) hits it and then falls back hard. Oil is now seeking support at the 20 day SMA at 83.95 and near 84 support. Below that there is support at 81. The RSI is falling hard as well but not yet at the mid-line, a point it has not meaningfully crossed since moving above in early September. The MACD is also weaker and about to cross down, creating an environment for lower prices short term. The weekly chart shows a much more bullish picture for Crude. After a strong move up from the wedge last week it held near the top of that candle this week. The MACD is fairly flat on a weekly timeframe and the RSI is strong. It appears that any further pullback might be halted at 81. A good tell would be the RSI from the daily chart which has picked the bottom near 30 twice recently.
US Dollar Index Daily
US Dollar Index Weekly

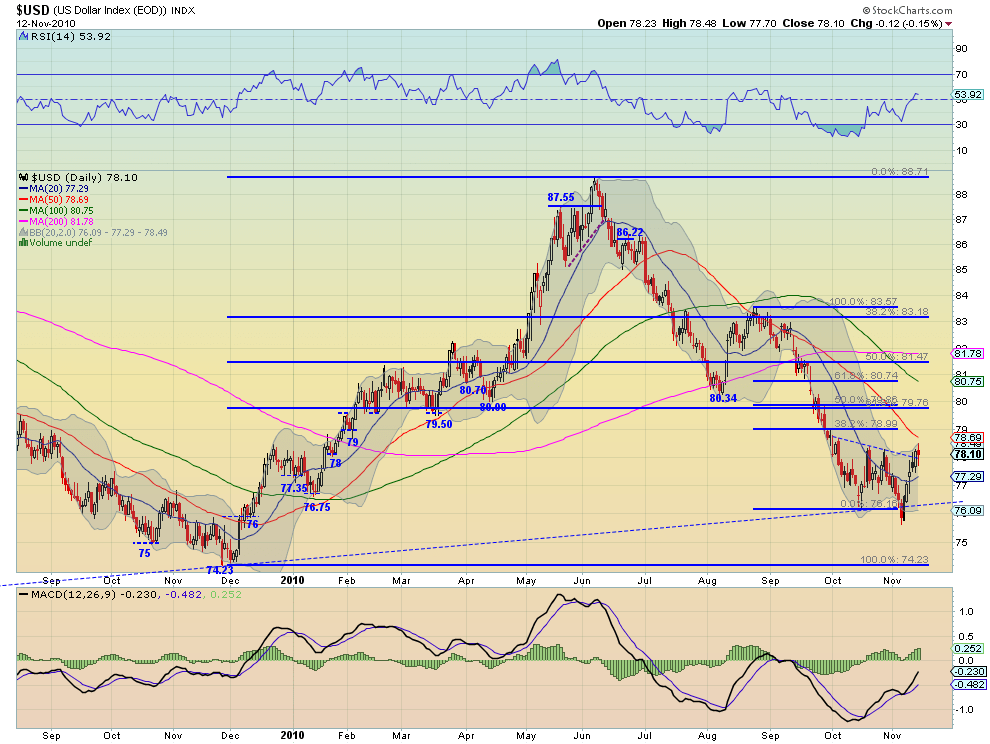
The US Dollar Index put in a very productive week and looks like it could still move higher. On the daily chart it broke above and turned up the 20 day SMA and then broke through the falling trend line from the beginning of October Friday. If it can get through the 77.28 area which is resistance on the daily chart the next resistance area is at 78.77 though 79. The resistance at 79 is confirmed on the weekly chart as well. The weekly chart shows the RSI bouncing at 30 with the MACD now improving as well. It does appear to have averted death by failing to break the neckline of the Inverse Head and Shoulder pattern on the weekly chart. 76.15 is a key support level if the 20 day SMA and 77 do not hold.
iShares Barclays 20+ Yr Treasury Bond Fund Daily
iShares Barclays 20+ Yr Treasury Bond Fund Weekly

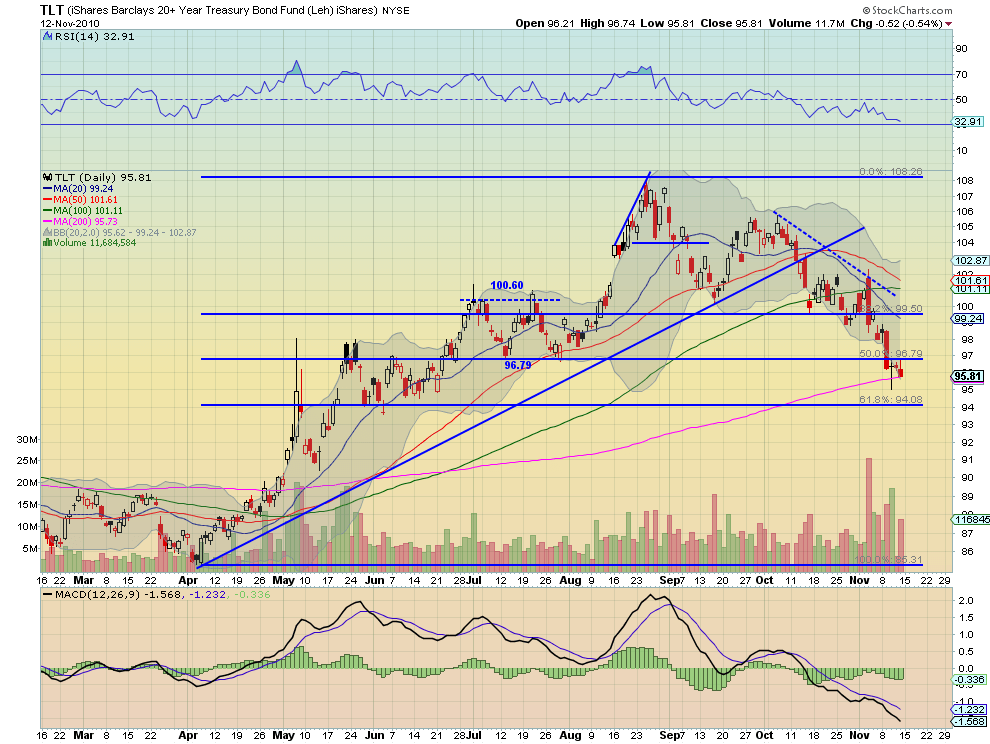
US Treasury Bonds really had a rough week. On Wednesday they broke down through the 50% retracement of the up move from April to the August highs and have been leaking lower since. I expect that to continue. Friday’s close just above the 200 day SMA at 95.73 is the last support on the daily chart before 94.75 followed by 94. Under that it can get really ugly. The RSI is smoothly sliding lower and the MACD is growing increasingly negative on the daily chart suggesting that the slide is not over yet. The weekly chart looks even worse with support at 95 to 95.50 and then the cross of the 50 and 100 week SMA’s below that at 94.15-94.34 and an RSI with lots of room before being oversold and a MACD that is increasing rapidly. Should it catch a bid somewhere the first upside resistance comes at the 96.79 Fibonacci level and then 97.69, the bottom of the channel on the weekly chart from July.
iShares MSCI Emerging Markets Index Daily
iShares MSCI Emerging Markets Index Weekly
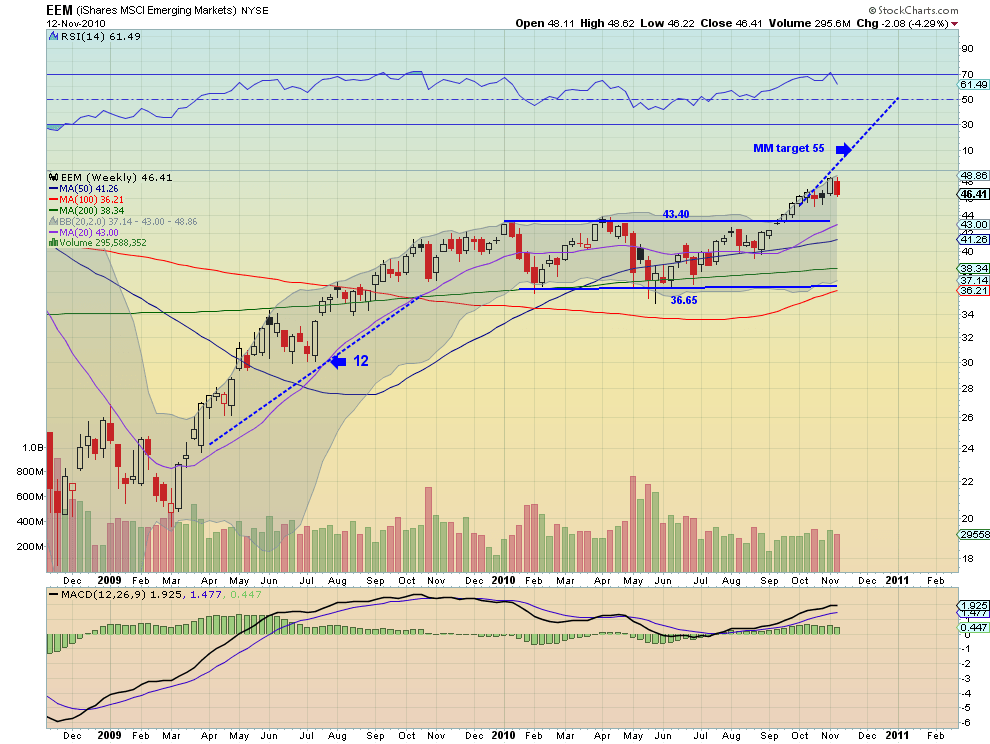
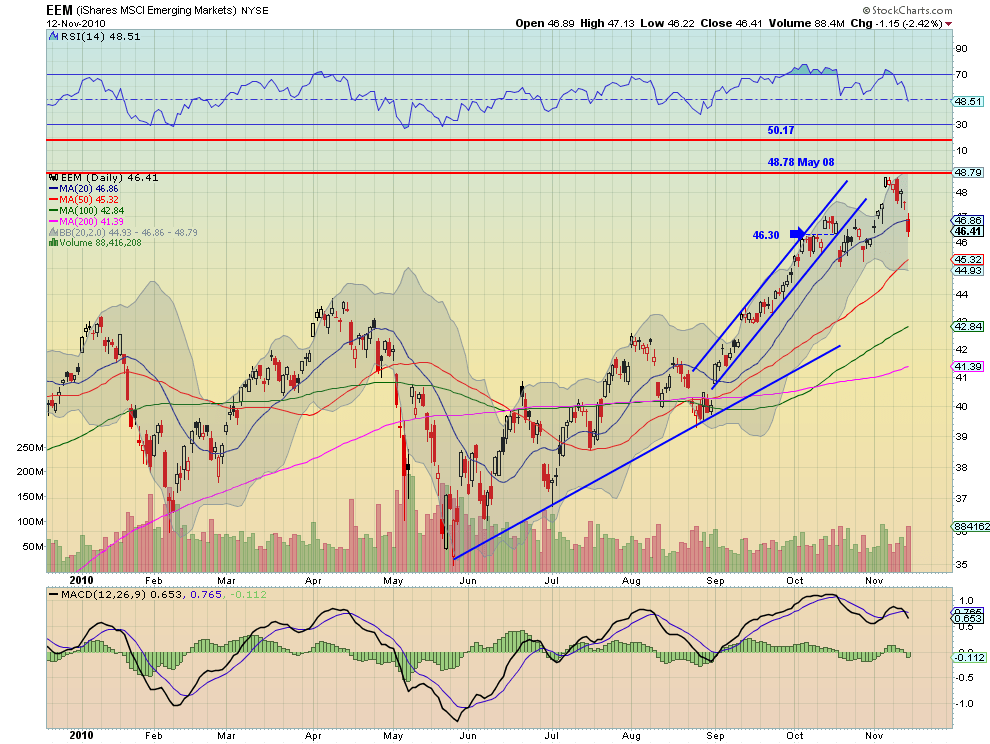
The Emerging market ETF failed at its first attempt to go through the high from May 2008 at 48.78 and has pulled back since. It lost the support of the 20 day SMA today and now sees support at 46.30 followed by 45.32, the 50 day SMA. If it bounces here expect a retest of the highs as the RSI is falling fast but is right the 50 level. The weekly chart shows the ETF consolidating after a breakout of a 9 month channel. The target on a measured move (the height of the move before entering the channel added to the break out level) on the break out is 55 so a pause along the way is welcome. Expect that if the 45.32 level does not hold support that the 43.40 channel breakout level might.
VIX Daily
VIX Weekly

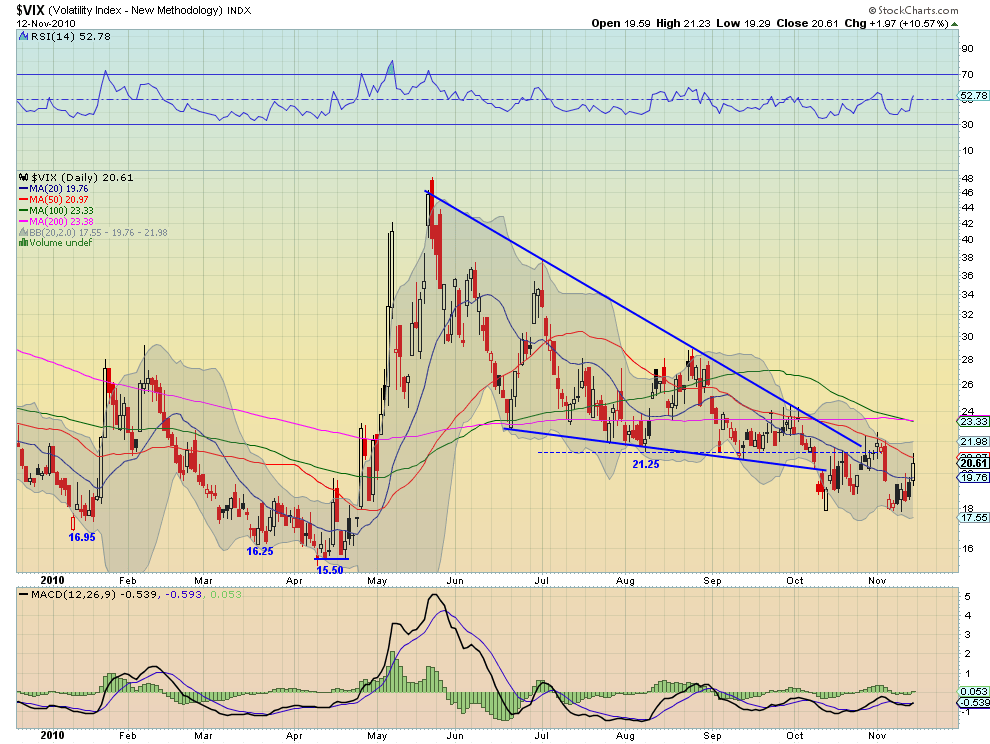
Volatility, as measured by the Volatility Index, is creeping back into the market but is still relatively low. The daily chart shows that it rejected at the 50 day SMA at 20.97, before the major resistance level at 21.25. The weekly chart is now showing a stair step pattern lower. There is support at 18 from the daily chart and the near 17 and on down to 15.50. If it increases above the 21.25 level expect it to meet resistance at the 23.33 level where the 100 and 200 day SMA’s are sitting just below the historic 24 resistance.
SPY 60 minute
SPY Daily
SPY Weekly

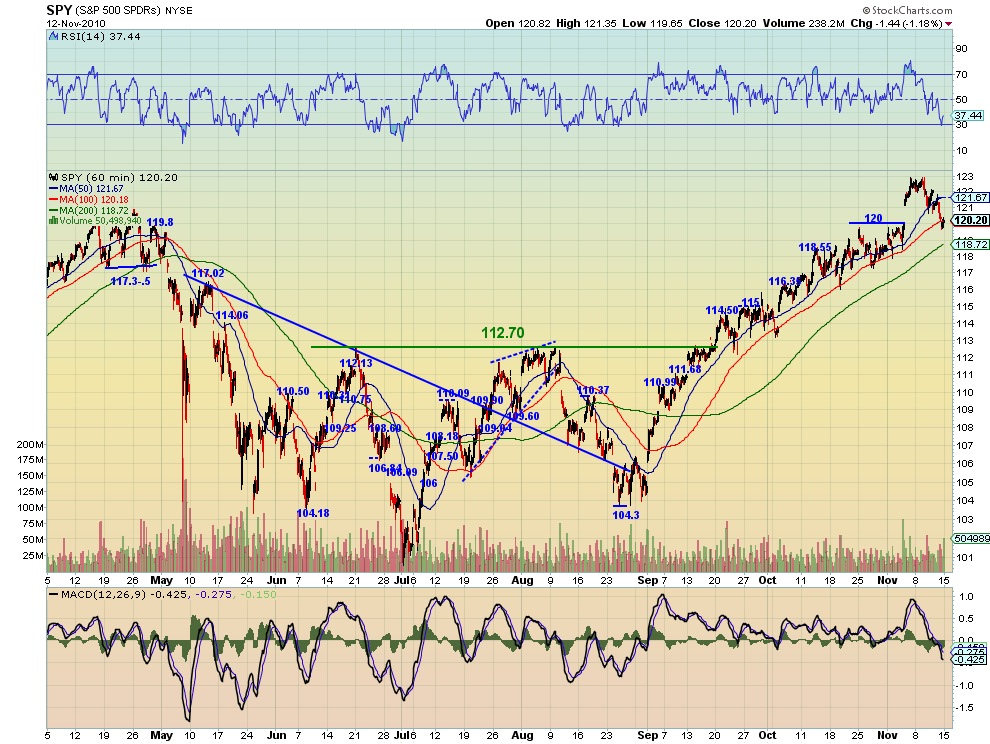
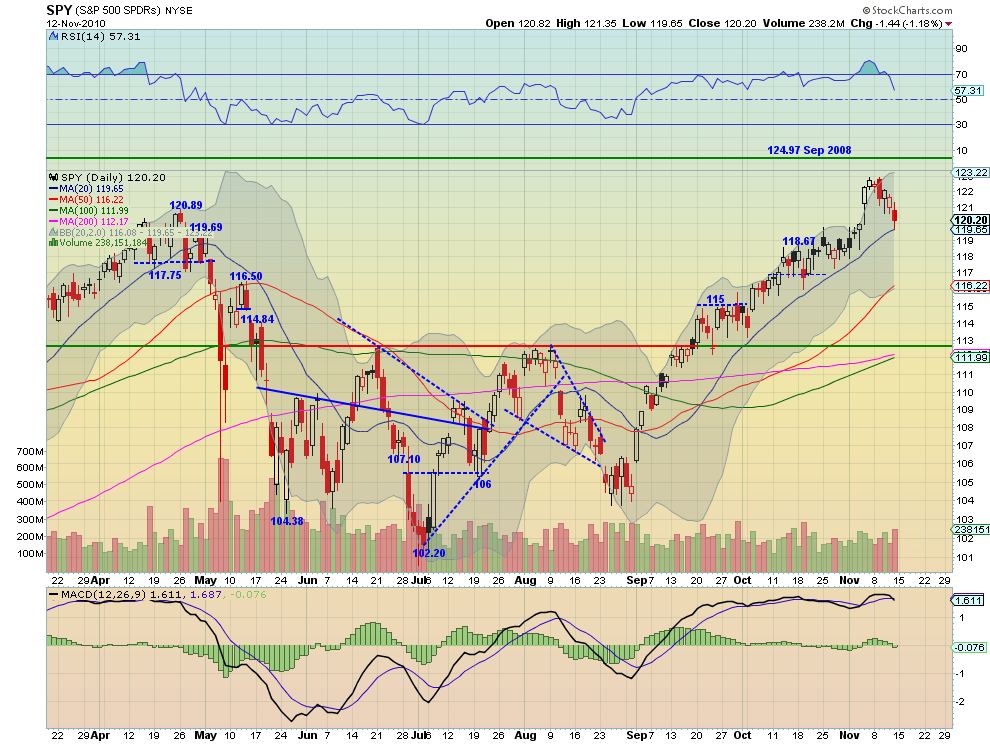
The short term hourly chart for SPY shows that it filled the gap up from November 4 today overshot and then recovered to the 100 hour SMA near at 120.18. Holding support of the pre-election top near 120 is important. The daily chart shows that the overshoot bounced at the 20 day SMA at 119.65 and also shows the candle’s real body holding above the top of the hammer that was the previous top 9 days earlier. It has been in a short term down trend for a week now, but the longer term uptrend is not in danger at this point. There is still support at 119.65 and the area of 118.75 through 119. the start of a longer daily downtrend for me comes on a break of 117. If it holds at the 20 day SMA then resistance can be found higher at 120.89 and 123 before the September 2008 highs at 124.97. The weekly chart immediately appears more bullish with the start of a flag forming after a trend higher, a consolidation as the RSI bounced off of 70. The MACD on the weekly is also strong. Overall, it appears that there may be further pullback in the short run but the longer time-frame chart looks good. If I am right then I expect the 118.75-119 area to hold as support.
IWM Daily
IWM Weekly

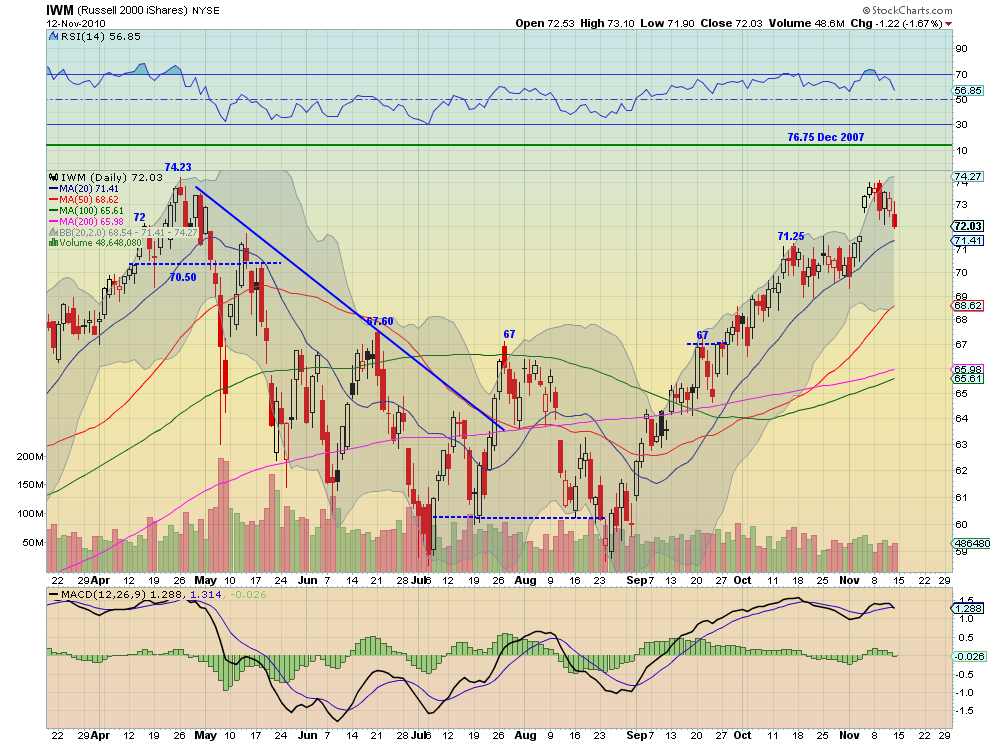
IWM is similar to the SPY expect that it did not fill the post-election gap up. The falling RSI and MACD suggest that may happen soon. It is sitting on top of support from April at 72 and a gap level near 71.75. If those should fail then there is additional support at the 20 day SMA at 71.41. The weekly chart offers a suggestion that the touch of the downward trend line from 2008 might have something to do with the resistance. To the upside of this trend line resistance is found at 74.23 and then 76.70. The RSI on the weekly has slightly backed off of 70, so it has room to the upside, which is also supported by the strong MACD. Again it seems a short term pullback may continue slightly longer but the uptrend still shows strong on the weekly chart.
QQQQ Daily

QQQQ Weekly

Finally, the QQQQ is the worst looking of the bunch on a daily timeframe but also positive on the weekly chart. This filled the post-election gap on Thursday and moved lower again on Friday. It is sitting on support of the 20 day SMA at 52.45 and has further support below at 51.72 and then 51. The RSI and MACD on the daily chart suggest that it may still run lower. Like SPY and IWM, the weekly chart is bullish, showing QQQQ hitting some resistance in the uptrend at the 100% retracement of the down move from the 2008 highs to the 2009 lows. The RSI is high and just glanced off of 70 and the MACD is strong. So like the SPY and IWM there may be a bit more of a pullback but the charts now suggest that it will be short lived before a run higher.
So for next week it looks like the short term damage in Gold and Crude Oil may continue, within the long term upward moves. The US dollar Index can prove that is is reversing and strengthening if it continues higher. US Treasury Bonds appear weak and headed lower in price. Emerging Market and US equities may also see short term continued downward pressure, but it appears to be limited when looking at the longer term trend and time-frames.
God luck next week and trade’m well!
If you like what you see above sign up for deeper analysis and trading strategy by using the Get Premium button above. As always you can see details of individual charts and more on my StockTwits page.
The information in this blog post represents my own opinions and does not contain a recommendation for any particular security or investment. I or my affiliates may hold positions or other interests in securities mentioned in the Blog, please see my Disclaimer page for my full disclaimer.
blog comments powered by Disqus
-
 Gregory W. Harmon CMT, CFA, has traded since 1986 and held senior positions including Head of Global Trading, Head of Product Development, Head of Strategy and Director of Equity. (More)
 -
Subscribe to Dragonfly Capital Views
Lifetime Subscription
$4,000.00Sign upAnnual Subscription
$1,000.00Sign upQuarterly Subscription
$350.00Sign up
Recent Posts
- Bull Scan for 10-14-26
- Premium Earnings 10-13-26: Fastenal and Morgan Stanley
- Bull Scan for 10-13-26
- Premium Earnings 10-12-26: Citigroup and Johnson & Johnson
- 4 Trade Ideas Wells Fargo: Bonus Idea
- 5 Trade Ideas for Monday: AbbVie, Airbnb, Affirm, GE Aerospace and Walmart
- Top Trade Ideas for the Week of October 12, 2026: The Rest Premium
- Top Trade Ideas for the Week of October 12, 2026: The Best
- SPY Trends and Influencers October 10, 2026
- Macro Week in Review/Preview October 9, 2026
Archives