Financials & Technology Guide Across Time – Sector Review April 2, 2011
- Posted by Greg Harmon
- on April 2nd, 2011
There is very little distinction between the SPDR Sector funds on all time frames. For those that believe the top is in for the market this is a sign of worry. For those that are looking for more upside this poses a problem in trying to decide where to focus. Let’s look at the evidence and then determine the best course of action.
Monthly
Eight of the nine sectors look very strong on the monthly time frame. They have strong uptrends and Relative Strength Index (RSI) solidly bullish near the technically overbought level at 70. They are at the top of the Bollinger bands with positive, if somewhat flat, Moving Average Convergence Divergence (MACD) indicators. But each also printed a Hanging Man candle on large relative volume for March. The Hanging Man is something to watch as it can be a reversal signal, but needs to be confirmed the following month. The glaring exception on this time frame is Financials Select Sector SPDR,$XLF, shown below.
Financials Select Sector SPDR,$XLF – Monthly

The major exception on this chart is that the RSI is flat near the mid line, not near the overbought level. Also the volume was bigger in March compared to February but not large relative to the last nine months. This sector continues to have a problem with resistance at the 38.2% retracement level of the major down move at 16.79. Look for a break of this level to create a strong opportunity to the upside for the Financials.
Weekly
On the shorter term weekly time frame the breadth of the move higher is equally strong. All sectors are at, near or moving towards highs, near the top of their Bollinger bands and with strong RSI pointing higher and improving MACD. But each sector has been showing lower volume the last 2 weeks. Again the standout trouble sector is the XLF, but it is joined by the Technology Select Sector SPDR,$XLK on this time frame. No time for a panic, but a notable distinction.
Financials Select Sector SPDR,$XLF – Weekly
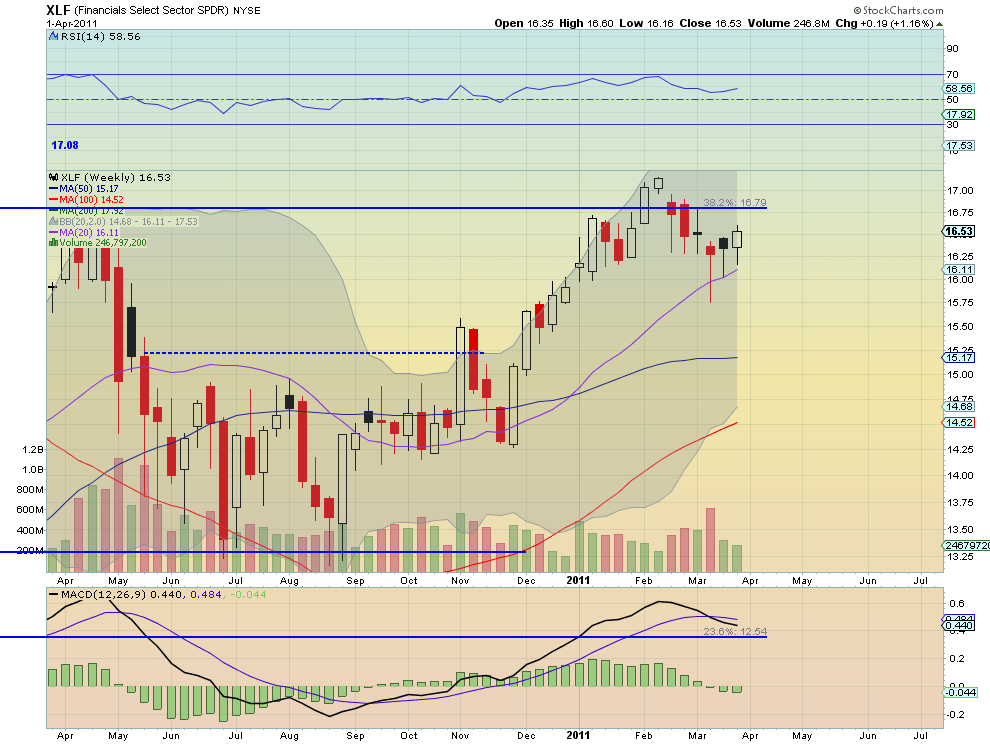
The XLF above and XLK below show just a couple of cracks relative to the other sectors. Both sectors are in the upper half of the Bollinger bands but much nearer to the mid point than the other sectors. The XLF shows a MACD that is growing more negative and the XLK printed a doji candle for the week, signaling a potential reversal if confirmed. Hardly a cause for alarm but distinctions to watch going forward, that may give a clue to the next direction.
Technology Select Sector SPDR,$XLK – Weekly
Daily
On the shorter daily time frame it is also a broadly rosy picture, but with some waring signs. Every sector is in the upper half of their Bollinger bands with 5 pressing the top. The RSI is rising and has been at strong levels and the MACD is either increasing or improving. But none of the sectors have steeply sloped SMA’s, in fact most of the 20 and 50 day SMA’s are flat or falling. And each sector ended the week higher with a bearish candle: Solid Black, Bearish Engulfing, Eving Star, Shooting Star, Hanging Man or Long Legged Doji, except for the Consumer Staples Select Sector SPDR,$XLP. But even the XLP is working on a 3 day island that can be interpreted as an evening Star.
The major standout on this time frame is the XLK, below. What makes it exceptional is that the RSI and MACD are moving lower and the volume may be increasing as the bearish signs all start to point in the same direction. This sector may be the tell for whether the market’s move higher can continue in the very short term.
Technology Select Sector SPDR,$XLK – Daily

So no matter what time frame you trade, the XLF and XLK can act as your guide to changing conditions. Keep an eye on them.
As always you can see details of individual charts and more on my StockTwits feed and on chartly.)
If you like what you see above sign up for deeper analysis and trading strategy by using the Get Premium button above. As always you can see details of individual charts and more on my StockTwits page.
The information in this blog post represents my own opinions and does not contain a recommendation for any particular security or investment. I or my affiliates may hold positions or other interests in securities mentioned in the Blog, please see my Disclaimer page for my full disclaimer.
blog comments powered by Disqus
-
 Gregory W. Harmon CMT, CFA, has traded since 1986 and held senior positions including Head of Global Trading, Head of Product Development, Head of Strategy and Director of Equity. (More)
 -
Subscribe to Dragonfly Capital Views
Lifetime Subscription
$4,000.00Sign upAnnual Subscription
$1,000.00Sign upQuarterly Subscription
$350.00Sign up
Recent Posts
- Bull Scan for 10-13-26
- Premium Earnings 10-12-26: Citigroup and Johnson & Johnson
- 4 Trade Ideas Wells Fargo: Bonus Idea
- 5 Trade Ideas for Monday: AbbVie, Airbnb, Affirm, GE Aerospace and Walmart
- Top Trade Ideas for the Week of October 12, 2026: The Rest Premium
- Top Trade Ideas for the Week of October 12, 2026: The Best
- SPY Trends and Influencers October 10, 2026
- Macro Week in Review/Preview October 9, 2026
- Bull Scan for 10-12-26
- How this Week’s Premium Top 10 Performed, October 9, 2026
Archives