Egads! Strike in Suez, Brent Oil over $100, What to Do? Sell Gas
- Posted by Greg Harmon
- on February 8th, 2011
Natural Gas That Is
With all that has been happening in the Middle East it is no wonder the focus has been on Crude Oil of late. Brent vs West Texas Intermediate. The impact of a strike at the Suez Canal. What are we going to do? Oh wait, what’s that other fuel we use, Natural Gas? How has that been doing? As it turns out it is getting cheaper. Below is a chart for Natural Gas over the last 17 months through to yesterday (the Natural Gas charts are End of Day – Nat Gas currently trading at 4.058-4.059 as I write this).

There are three things to notice on this chart. First, Natural Gas has been in a long term down trend since the beginning of 2010. Second, from November through to the end of January it has started an upward channel within that down trend, eventually breaking the downtrend. Third, it is now reverting back below the down trend and under the channel. Now zoom in on the last 5 five months on the chart below.

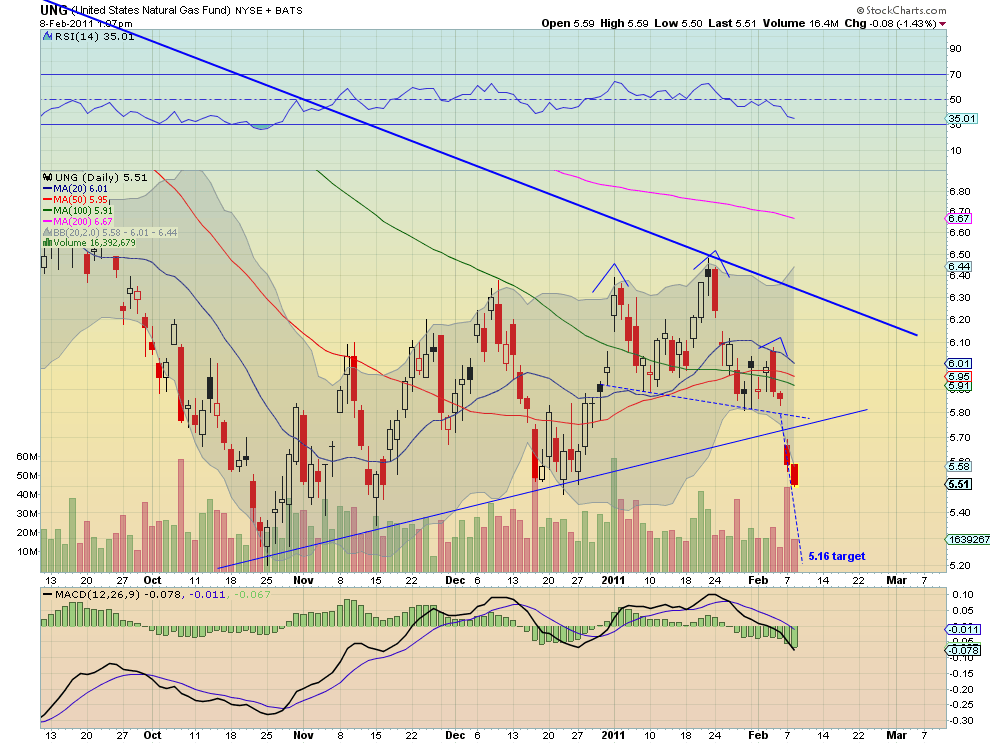
Notice first that the down trend line is also acting as the neckline for a Head and Shoulders pattern. Also the price fell through the 100 day Simple Moving Average (SMA) yesterday. The Relative Strength Index (RSI) is accelerating lower and the Moving Average Convergence Divergence (MACD) indicator is becoming more negative. As this happens the Bollinger bands are expanding allowing for the price to fall further. The Head and Shoulders target is at least 3.69 but there is also support lower at 3.48. You could short the Natural Gas futures here with a stop at the neckline looking for that target. What’s that you say? You don’t play futures. No problem. Look at the same 5 month chart for UNG, the Natural Gas ETF below. Although it never cleared the down trend line and the recent up trend is not as clean a channel, the same short term uptrend within a downtrend with a Head and Shoulders top is right there to see. And the same falling RSI and negative MACD with expanding Bollinger bands exist, allowing for a short opportunity with a target of 5.16. Here you might use 5.58 – 5.60 as a stop.
(As always you can see details of individual charts and more on my StockTwits feed and on chartly.)
If you like what you see above sign up for deeper analysis and trading strategy by using the Get Premium button above. As always you can see details of individual charts and more on my StockTwits page.
The information in this blog post represents my own opinions and does not contain a recommendation for any particular security or investment. I or my affiliates may hold positions or other interests in securities mentioned in the Blog, please see my Disclaimer page for my full disclaimer.
blog comments powered by Disqus
-
 Gregory W. Harmon CMT, CFA, has traded since 1986 and held senior positions including Head of Global Trading, Head of Product Development, Head of Strategy and Director of Equity. (More)
 -
Subscribe to Dragonfly Capital Views
Lifetime Subscription
$4,000.00Sign upAnnual Subscription
$1,000.00Sign upQuarterly Subscription
$350.00Sign up
Recent Posts
- Premium Earnings 10-13-26: Fastenal and Morgan Stanley
- Bull Scan for 10-13-26
- Premium Earnings 10-12-26: Citigroup and Johnson & Johnson
- 4 Trade Ideas Wells Fargo: Bonus Idea
- 5 Trade Ideas for Monday: AbbVie, Airbnb, Affirm, GE Aerospace and Walmart
- Top Trade Ideas for the Week of October 12, 2026: The Rest Premium
- Top Trade Ideas for the Week of October 12, 2026: The Best
- SPY Trends and Influencers October 10, 2026
- Macro Week in Review/Preview October 9, 2026
- Bull Scan for 10-12-26
Archives