Don’t Sprint to Buy Sprint Yet
- Posted by Greg Harmon
- on March 22nd, 2011
AT&T decided to buy T-Mobile over the weekend and the market responded by selling off Sprint stock hard. Nearly six times as much stock changed hands as normal and the price fell over 13.6%. Many traders look at this and start drooling, expecting a bounce. So should you get out your welding gloves and try to catch this falling knife? Maybe not. Let’s take a look at the technicals.
Sprint, ticker:$S, Weekly Chart
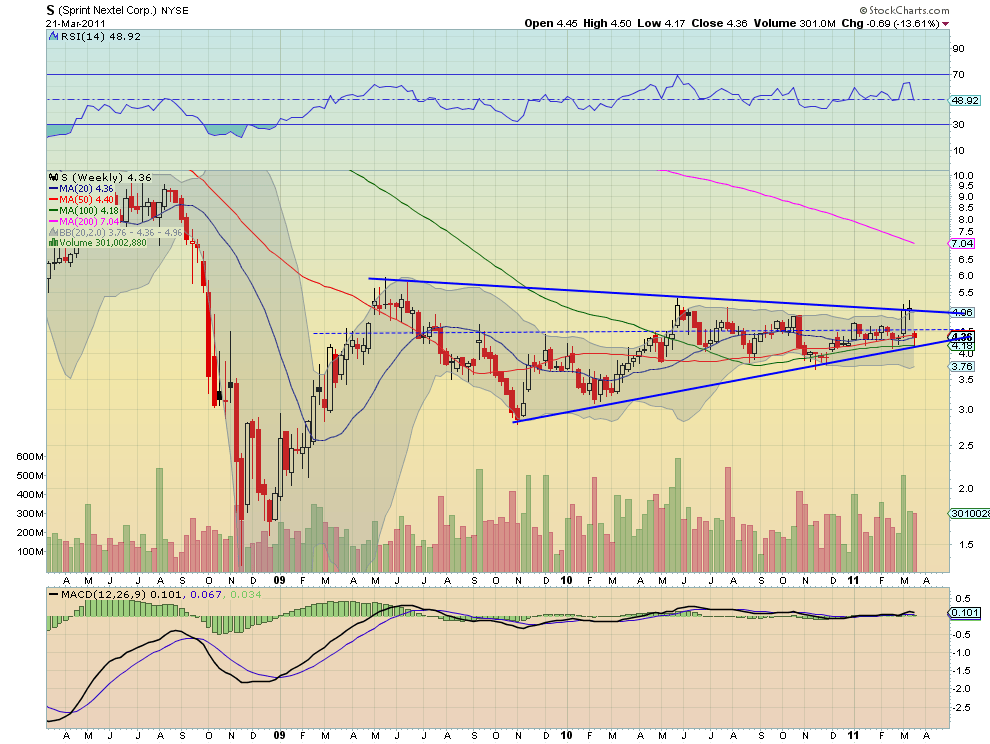
The weekly chart usually has little meaning to a day trader, the ones looking to catch the quick bounce, so just one quick point. Sprint has been in a symmetrical triangle for 18 months and was trying to break out last week. On this timeframe what happened is no more than a failed breakout, still within the triangle. Move along, nothing to see here. Now on to the daily chart.
Sprint, ticker:$S, Daily Chart
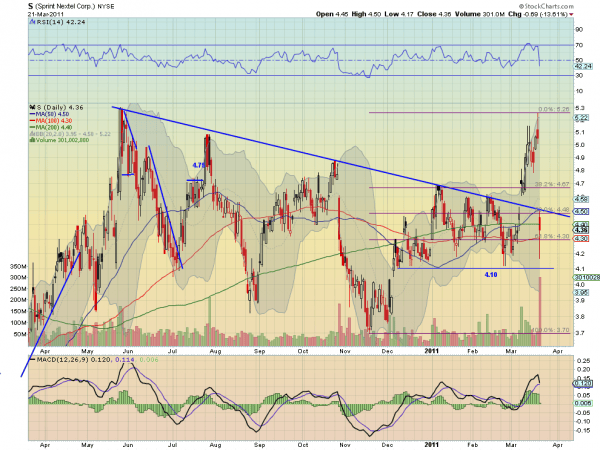
The daily chart paints a pretty negative picture for a knife catcher. First, the fall put it back under the falling trend line creating resistance there at 4.50 just above the Fibonacci resistance level at 4.48. Next the Relative Strength Index is sloped like a double diamond ski run moving lower. Third the Moving Average Convergence Divergence was falling before the plunge and now looks ready to cross bearishly lower. Next there is plenty of room in the expanding Bollinger bands for further downside even below the previous support level at 4.10. The only positive is that it printed a Hammer candle today, but that needs to be confirmed. What about on a shorter, traders, time frame.
Sprint, ticker:$S, 5 Minute Chart
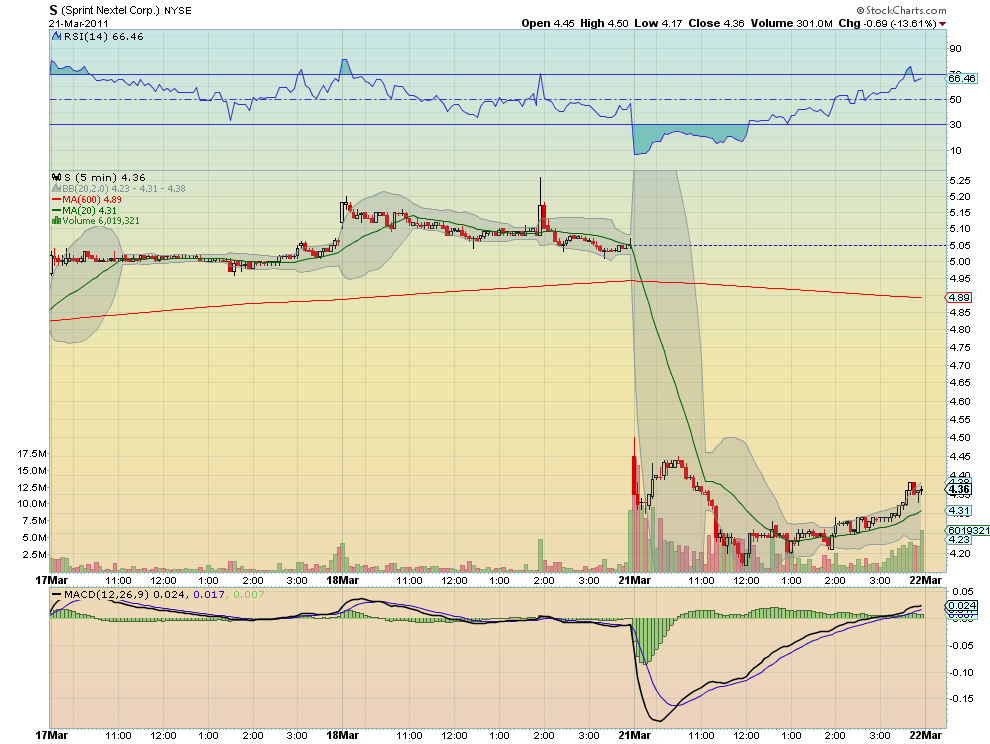
On this 5 minute chart the fall initially was outside of the Bollinger bands but quickly came back in. This stock fell, bounced slightly and then fell some more. Not the price and volume action you want to see for a bounce play. But as the day wore on the price action began to look better around 2:00 when it started rising steadily with increasing volume. It finished the day rising but near an overbought condition. The 4.45 level has become resistance on this chart having failed there twice. That is only 9 cents away from where it closed.
Game Plan
Looks like the upside on this name has 3 levels of resistance at 9, 12 and 14 cents above where it is now. The downside support however at the 4.30 Fibonacci level, then 4.20 from the 5 minute chart and 4.10 previous support seems a whole lot riskier. So is this stock ripe for you to swoop in and pick it up cheap? You decide it is your money, but I will be watching it from the sidelines until none of these levels are in play.
(As always you can see details of individual charts and more on my StockTwits feed and on chartly.)
If you like what you see above sign up for deeper analysis and trading strategy by using the Get Premium button above. As always you can see details of individual charts and more on my StockTwits page.
The information in this blog post represents my own opinions and does not contain a recommendation for any particular security or investment. I or my affiliates may hold positions or other interests in securities mentioned in the Blog, please see my Disclaimer page for my full disclaimer.
blog comments powered by Disqus
-
 Gregory W. Harmon CMT, CFA, has traded since 1986 and held senior positions including Head of Global Trading, Head of Product Development, Head of Strategy and Director of Equity. (More)
 -
Subscribe to Dragonfly Capital Views
Lifetime Subscription
$4,000.00Sign upAnnual Subscription
$1,000.00Sign upQuarterly Subscription
$350.00Sign up
Recent Posts
- Bull Scan for 10-13-26
- Premium Earnings 10-12-26: Citigroup and Johnson & Johnson
- 4 Trade Ideas Wells Fargo: Bonus Idea
- 5 Trade Ideas for Monday: AbbVie, Airbnb, Affirm, GE Aerospace and Walmart
- Top Trade Ideas for the Week of October 12, 2026: The Rest Premium
- Top Trade Ideas for the Week of October 12, 2026: The Best
- SPY Trends and Influencers October 10, 2026
- Macro Week in Review/Preview October 9, 2026
- Bull Scan for 10-12-26
- How this Week’s Premium Top 10 Performed, October 9, 2026
Archives