Deep Dive: Turning Japanese
- Posted by Greg Harmon
- on March 15th, 2011
The Japan iShares ETF has been the focus of many traders the past few days. We all know that it has fallen off the face of the Earth due to the horrible situation in Japan following the Earthquakes and Tsunami, and now threats to the Nuclear Reactors. But what can the charts tell us about that market that goes beyond the headlines. Let’s take a look.
Japan iShares, Daily, Ticker:$EWJ

The daily chart for EWJ above has some interesting information to share. The first thing to note is that it started falling well before this mess started, on March 1. By March 10th, the day before the tragedy, it had fallen over 5%. In fact there was a Head and Shoulders top that confirmed March 10th with a target of at least 10.79. This target was achieved on Friday March 11th, the day of the Earthquakes. The horrible news about the nuclear reactors then took it much lower on Monday and Tuesday. Now it is outside of the Bollinger bands and deeply oversold on the Relative Strength Index (RSI). The Moving Average Convergence Divergence (MACD) indicator has gone parabolic. Perhaps it bounces short term to get back into the Bollinger bands but that will release some pressure on the RSI and allow it to continue lower. What about the longer term prospects?
Japan iShares, Weekly, Ticker:$EWJ
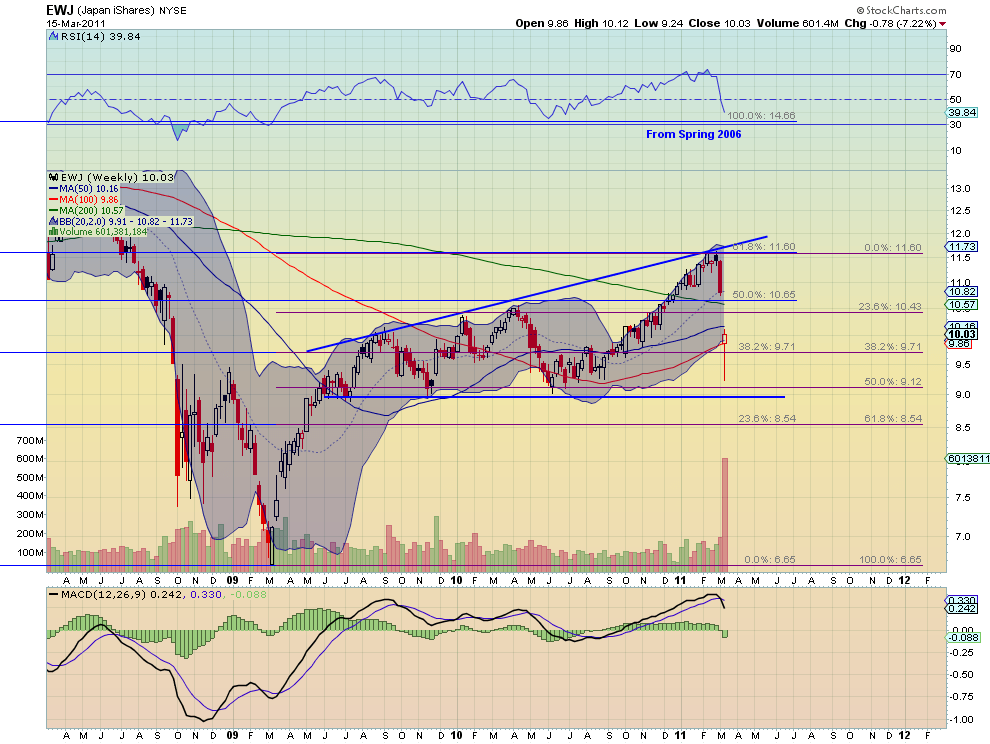
The weekly chart shows many pieces of information in play. First the ascending triangle that is bounded by the rising blue trend line. It bounced off of this trend line at the beginning of the month and started moving lower toward the base at 9.00. Next the larger scale blue Fibonacci lines show that the bounce lower occurred at the 61.8% retracement of the move from the highs in the Spring of 2006 to the lows in March 2009. Next the magenta Fibonacci lines show that the move lower has so far stalled just above the 50% retracement of the move higher from that March 2009 low to the February 2011 high. Something to watch for is that many of both sets of Fibonacci lines are identical, indicating that the technical retracements may be leading to forming a triangle with a tightening range. Third the price is now just above the bottom Bollinger Band, suggesting a bottom for the week, and if it finishes her will print a bullish reversal Hammer candle. This would need to be confirmed especially since the MACD has just crossed lower and the RSI is sloping steeply down, suggesting more downside to come. The support for a downside move comes at 9.00 and then at 8.54. Should it break 8.54 then expect a full retracement to 6.65.
Summary
The Japanese Market had started moving lower and the technicals forecast a good deal of the move before the tragedy occurred. These just added fuel to the downward move and now the hope is for support. Follow the charts to understand how the news is impacting the Japanese markets.
As always you can see details of individual charts and more on my StockTwits feed and on chartly.)
If you like what you see above sign up for deeper analysis and trading strategy by using the Get Premium button above. As always you can see details of individual charts and more on my StockTwits page.
The information in this blog post represents my own opinions and does not contain a recommendation for any particular security or investment. I or my affiliates may hold positions or other interests in securities mentioned in the Blog, please see my Disclaimer page for my full disclaimer.
blog comments powered by Disqus
-
 Gregory W. Harmon CMT, CFA, has traded since 1986 and held senior positions including Head of Global Trading, Head of Product Development, Head of Strategy and Director of Equity. (More)
 -
Subscribe to Dragonfly Capital Views
Lifetime Subscription
$4,000.00Sign upAnnual Subscription
$1,000.00Sign upQuarterly Subscription
$350.00Sign up
Recent Posts
- Bull Scan for 10-13-26
- Premium Earnings 10-12-26: Citigroup and Johnson & Johnson
- 4 Trade Ideas Wells Fargo: Bonus Idea
- 5 Trade Ideas for Monday: AbbVie, Airbnb, Affirm, GE Aerospace and Walmart
- Top Trade Ideas for the Week of October 12, 2026: The Rest Premium
- Top Trade Ideas for the Week of October 12, 2026: The Best
- SPY Trends and Influencers October 10, 2026
- Macro Week in Review/Preview October 9, 2026
- Bull Scan for 10-12-26
- How this Week’s Premium Top 10 Performed, October 9, 2026
Archives