Belt Ornaments, Canadian Calculators* or Paperweights?
- Posted by Greg Harmon
- on March 24th, 2011
Research in Motion (ticker: $RIMM) released earnings Thursday after the bell and then the stock proceeded to fall as much as low as 56 in after hours trading. Did anybody really think that the Canadian Calculator* Company, maker of vast numbers of Belt Ornaments issued throughout Corporate America, was going to show greatness? So is the stock destined to become a Paperweight like their products? Let’s take a look at the technicals on 3 timeframes.
RIMM Monthly
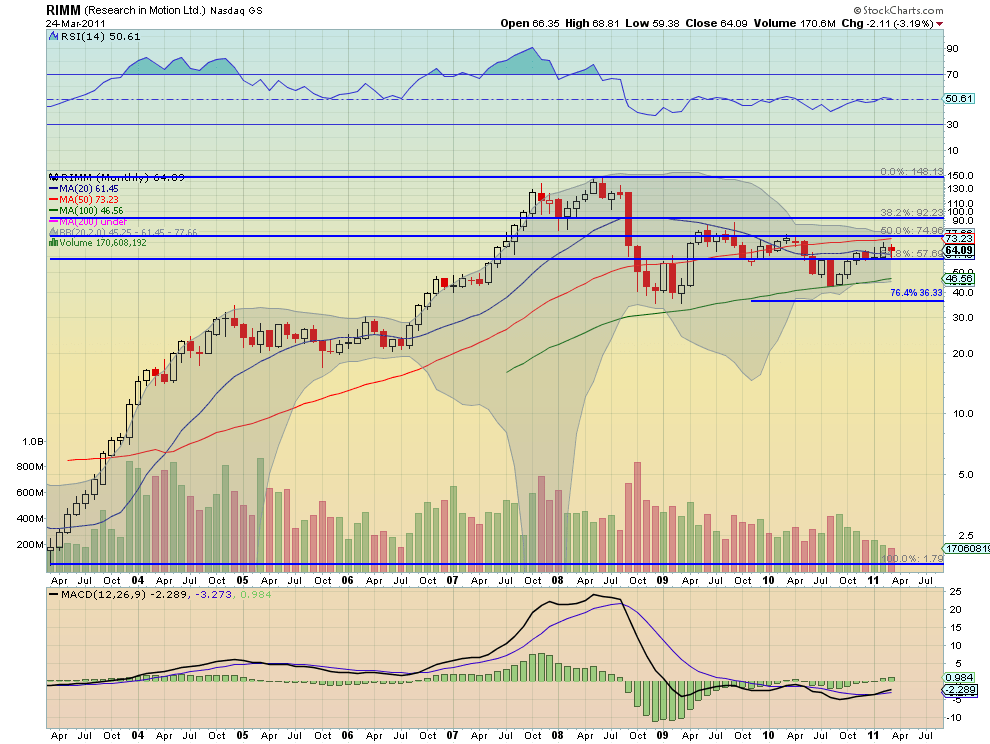
The monthly chart above shows three major concepts. First the Fibonacci levels show support of the 61.8% retracement has been tested and held each of the last last five months. Second the Simple Moving Averages (SMA’s) have flat lined near the 50% and 61.8% Fibonacci levels, at 57.69 and 74.96, and then the 46.50 area of support from mid 2010. Third, the Bollinger Bands are tightening preparing for a big move. 68 and then the 50% Fibonacci will cap the upside until then and the 61.8% Fibonacci and the 100 month SMA the downside. Current after hours trading the stock is below this level.
RIMM Weekly

The weekly chart shows there has been a bit of bullishness along with the market rally since September, with the Relative Strength Index breaking and holding over 50 since then. There is resistance above near 70 and then 76 on this timeframe. And there is support lower between 56 and 58 before open space down to 48.
RIMM Daily

The daily chart shows a rising broadening wedge or Megaphone pattern. This typically resolves downward and the after hours trading, highlighted by the red extension on the chart, suggests that this one will as well. Under the megaphone there as been support in the range from 55.80 to 58 several times. But below 55.8 the next support area is at 49.50 then 47 and 45-45.75.
So as RIMM opens for trading on Friday expect it to be lower. But there are many layers of support on multiple time frames in the range between 55.80 and 58, so it will take a lot of determined selling to get it below there. But a crack below that area may be a good place to short since the next major areas of support all are in the high 40’s.
(As always you can see details of individual charts and more on my StockTwits feed and on chartly.)
*Coined by Downtown Josh Brown, the Reformed Broker.
If you like what you see above sign up for deeper analysis and trading strategy by using the Get Premium button above. As always you can see details of individual charts and more on my StockTwits page.
The information in this blog post represents my own opinions and does not contain a recommendation for any particular security or investment. I or my affiliates may hold positions or other interests in securities mentioned in the Blog, please see my Disclaimer page for my full disclaimer.
blog comments powered by Disqus
-
 Gregory W. Harmon CMT, CFA, has traded since 1986 and held senior positions including Head of Global Trading, Head of Product Development, Head of Strategy and Director of Equity. (More)
 -
Subscribe to Dragonfly Capital Views
Lifetime Subscription
$4,000.00Sign upAnnual Subscription
$1,000.00Sign upQuarterly Subscription
$350.00Sign up
Recent Posts
- Bull Scan for 10-13-26
- Premium Earnings 10-12-26: Citigroup and Johnson & Johnson
- 4 Trade Ideas Wells Fargo: Bonus Idea
- 5 Trade Ideas for Monday: AbbVie, Airbnb, Affirm, GE Aerospace and Walmart
- Top Trade Ideas for the Week of October 12, 2026: The Rest Premium
- Top Trade Ideas for the Week of October 12, 2026: The Best
- SPY Trends and Influencers October 10, 2026
- Macro Week in Review/Preview October 9, 2026
- Bull Scan for 10-12-26
- How this Week’s Premium Top 10 Performed, October 9, 2026
Archives