Amazon May be a Buy: A Review in 3 Time Frames
- Posted by Greg Harmon
- on January 28th, 2011
Amazon (Ticker: AMZN) presented their earnings Thursday night and the price reaction was similar to many of the current rally leaders, it fell. It fell big. From an intraday high of 185 to a low of 165. When this happens you hear a lot of “the sky is falling” predictions. But what does this reaction mean about future price action? Let’s muse over the charts in a few different time frames and gain better perspective. Below is the monthly chart.

Stepping back gives a bit of perspective. This monthly chart shows the full lifespan for AMZN since 1997. There are several ideas illustrated here. First note that the Simple Moving Averages (SMA’s) are all pointing higher. If this initial reaction holds that will not change that the trend of the SMA’s is higher. Second, notice that price is just now tangling 61.8% (an important Fibonacci level) above the highs of the move from it’s initial listing to the first peak in 1999, at 182.02. Some resistance should be expected there. Next the price had been trading in a rising channel and recently broke the channel higher. It would be normal for the price to retest the break of that channel at about 170. Fourth, the Relative Strength Index (RSI) is becoming a bit overbought, not materially, but something to watch, but the Moving Average Convergence Divergence (MACD) indicator is still large and bullish. Finally, if it does pullback here, I have proposed a bullish Elliott Wave count putting AMZN in the corrective wave (iv) within wave (5) of the motive wave (III). All that means is that it would be due for a pullback or sideways over several months before heading even higher to complete the advancing wave probably near 220 or so. Elliot Wave rules would suggest that the pullback would not go below about 130. So on a longer timeframe there is room for a significant pullback, but not a requirement. Moving to the weekly chart below gives another account of the price action.

This chart suggests that if the downward price action continues that there might be some support at the 20 week SMA at 171, which has also been a previous support area in November. Below that there is also support at 165 from October 2009 (and near where it appears to be settling in the after hours market) and then the 23.6% retracement of the up move from November 2008 at 154.57. Note also that the move from the bottom to the consolidation zone and then breaking higher, would suggest a similar move on the upside giving a longer term target of 225, similar the the monthly target, suggesting any pullback is temporary. Finally lets move to the daily chart.
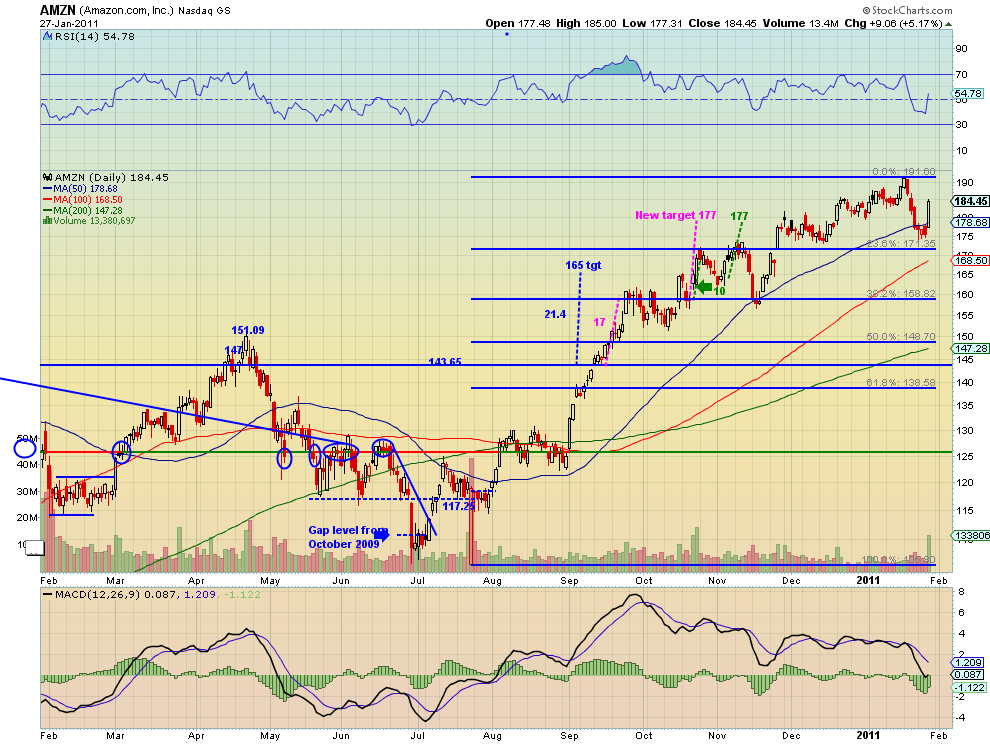
The daily chart shows that there have been many bounces in the 155 to 165 area since September 2009. It also gives the 23.6% and 38.2% retracements of the up move from August 2009 at 158.82 and 171.35. I would expect that the pullback would be confined to roughly to this range before a move higher. So the pullback on earnings could continue lower but is likely to find support and move higher again soon. Good luck with it tomorrow.
None of these charts reflect the after hours move in response to the earnings announcement, due to limitations in the spectacular charting software. And as always you can see details of individual charts and more on my StockTwits feed and on chartly.)
If you like what you see above sign up for deeper analysis and trading strategy by using the Get Premium button above. As always you can see details of individual charts and more on my StockTwits page.
The information in this blog post represents my own opinions and does not contain a recommendation for any particular security or investment. I or my affiliates may hold positions or other interests in securities mentioned in the Blog, please see my Disclaimer page for my full disclaimer.
blog comments powered by Disqus
-
 Gregory W. Harmon CMT, CFA, has traded since 1986 and held senior positions including Head of Global Trading, Head of Product Development, Head of Strategy and Director of Equity. (More)
 -
Subscribe to Dragonfly Capital Views
Lifetime Subscription
$4,000.00Sign upAnnual Subscription
$1,000.00Sign upQuarterly Subscription
$350.00Sign up
Recent Posts
- Premium Earnings 10-13-26: Fastenal and Morgan Stanley
- Bull Scan for 10-13-26
- Premium Earnings 10-12-26: Citigroup and Johnson & Johnson
- 4 Trade Ideas Wells Fargo: Bonus Idea
- 5 Trade Ideas for Monday: AbbVie, Airbnb, Affirm, GE Aerospace and Walmart
- Top Trade Ideas for the Week of October 12, 2026: The Rest Premium
- Top Trade Ideas for the Week of October 12, 2026: The Best
- SPY Trends and Influencers October 10, 2026
- Macro Week in Review/Preview October 9, 2026
- Bull Scan for 10-12-26
Archives