Top 10 Trade Ideas for the Week of November 8, 2010
- Posted by Greg Harmon
- on November 7th, 2010
After looking at over 500 charts and posting my thoughts on many of them, I have found some good setups for the week. For the first time this week’s list contains 11 long ideas. These were selected and should be viewed in the context of the broad market daily and weekly trend, reviewed Friday, which looks to bring stronger prices for Gold and Oil and further weakness for the US Dollar Index and US Treasury Bonds. This will aid emerging market stock prices. Volatility looks to continue to be relatively low and weak giving a supportive environment for equity prices to continue their rise. Sector analysis supports a market rise as discussed in yesterday’s Sector Review, with a rotation of leaders to now include the financial stock.
(As always you can see these individual charts and more on my twitter feed and on chartly.)
Here are the top ten for the week in alphabetical order:
1. Anadarko Petroleum, Ticker: APC
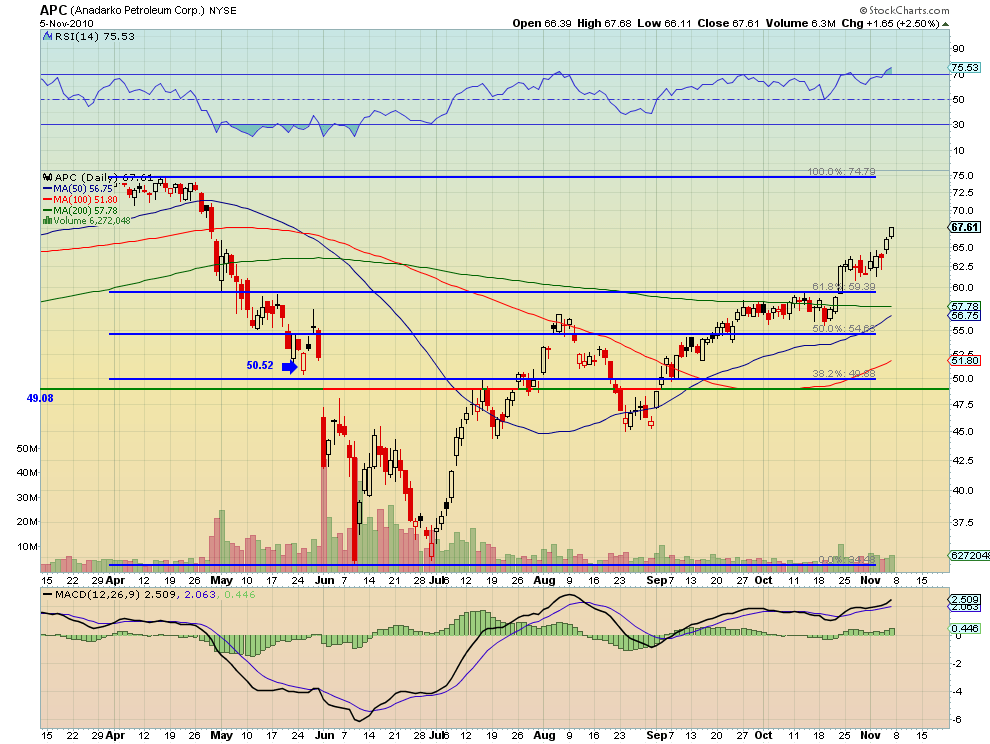
Anadarko broke higher Thursday (like many stocks) and is moving higher. looking left there is not resistance until it hits 70 and then the full retracement of the down move at 74.79. Use 67.28 as first support, the gap from April.
2. Cirrus Logic, Ticker: CRUS
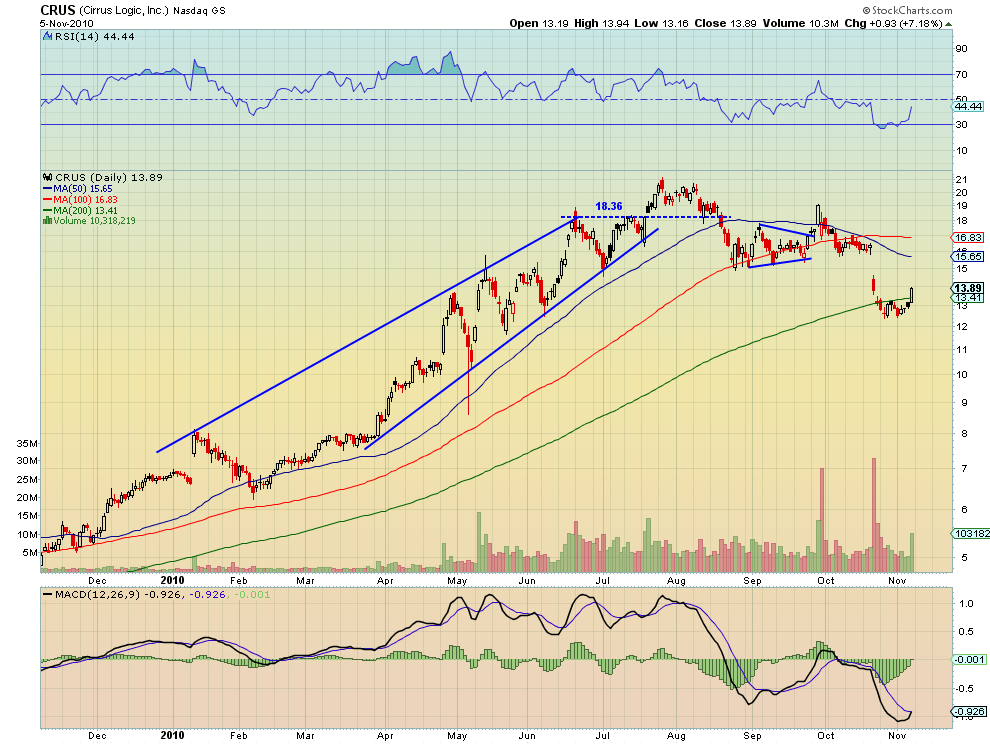
Cirrus Logic found a bottom and is moving higher now. The shape of the Relative Strength Index (RSI) and Moving Average Convergence Divergence (MACD) indicator and the volume all mirror the price movement and give support to further upside. Resistance is found at 15.65, and support at 13.41.
3. DirecTV, Ticker: DTV
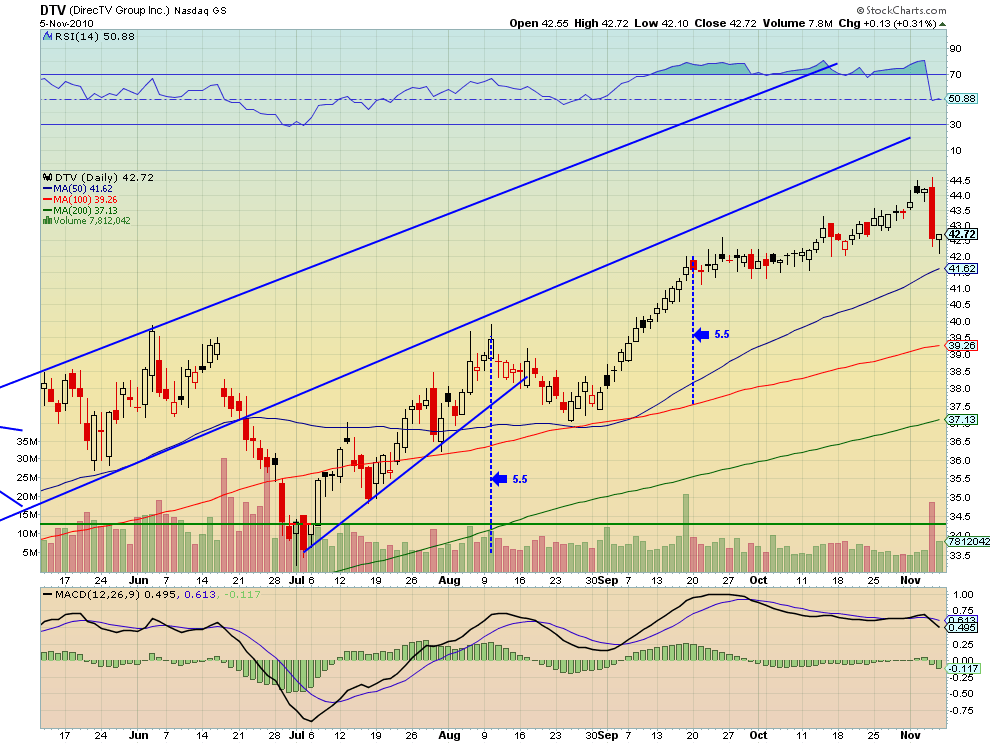
DirecTV took a header on Thursday but printed a bullish hammer candle on Friday. The RSI also bounced at 50. I am looking for reversal to resistance at 43.5 and then 44.50. First support can be found at the 41.62-42.00 area.
4. Ford, Ticker: F
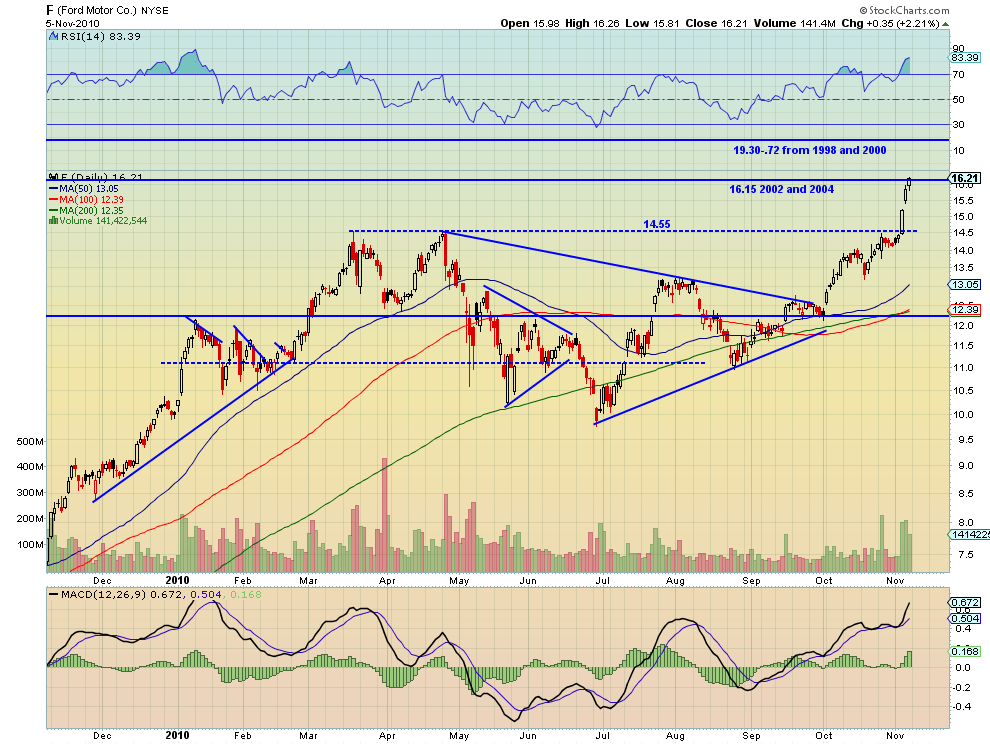
Ford has moved up to multi-year highs and gotten a lot of attention. If it can holds above the 16.15 level from 2002 and 2004 then it is ready for a new 10-12 year high at 19.30. The RSI is quite high so it may have to work off the overbought status before it can run. Support below 16.15 can be found at 15.25.
5. FedEx, Ticker: FDX
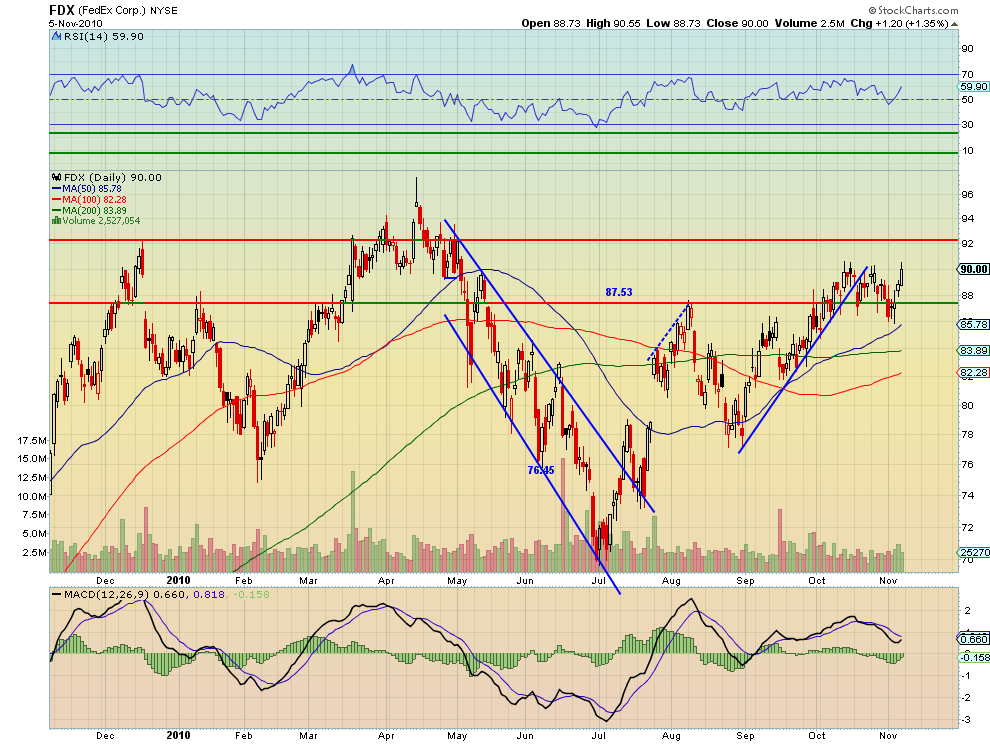
FedEx has bounced at 90 twice and is testing it for a third time. If it can get through 90 then resistance comes at 92.37 before it can try to retake the high in April at 95.13. A MACD cross and rising RSI support a push through this time.
6. Fortress Investment, Ticker: FIG
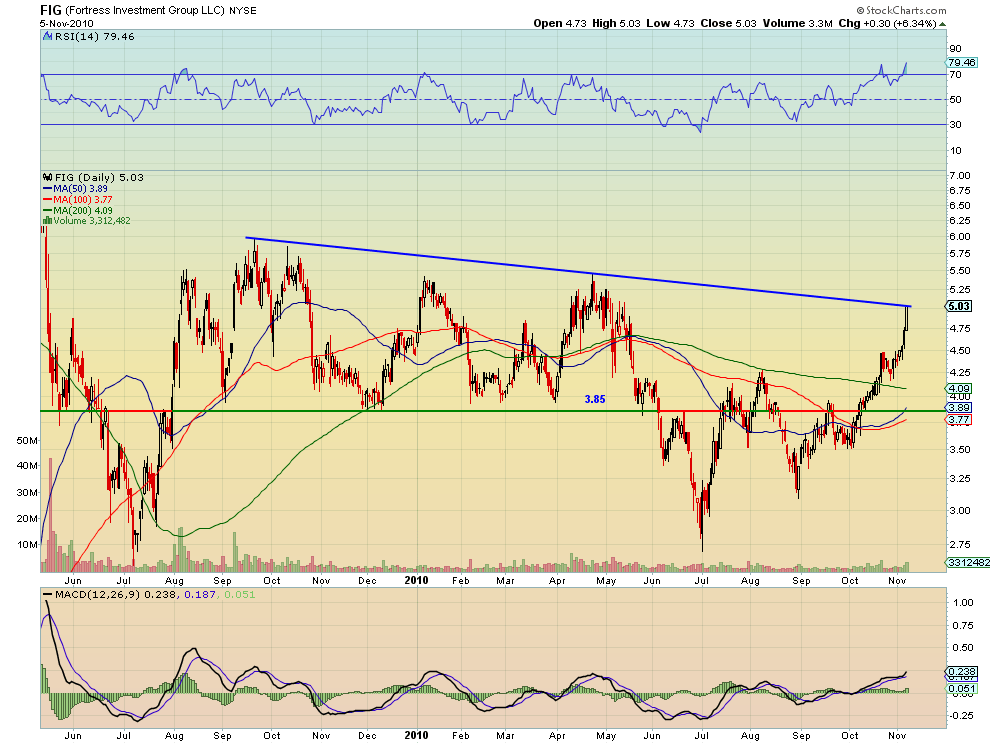
Fortress is testing the long downtrend line, currently at 5.05. If it can get through it then there is resistance at 5.47 followed by 6. A rising MACD and RSI give it a chance to get through. Downside is limited with support at 4.87
7. Hi Tech Pharmacal, Ticker: HITK
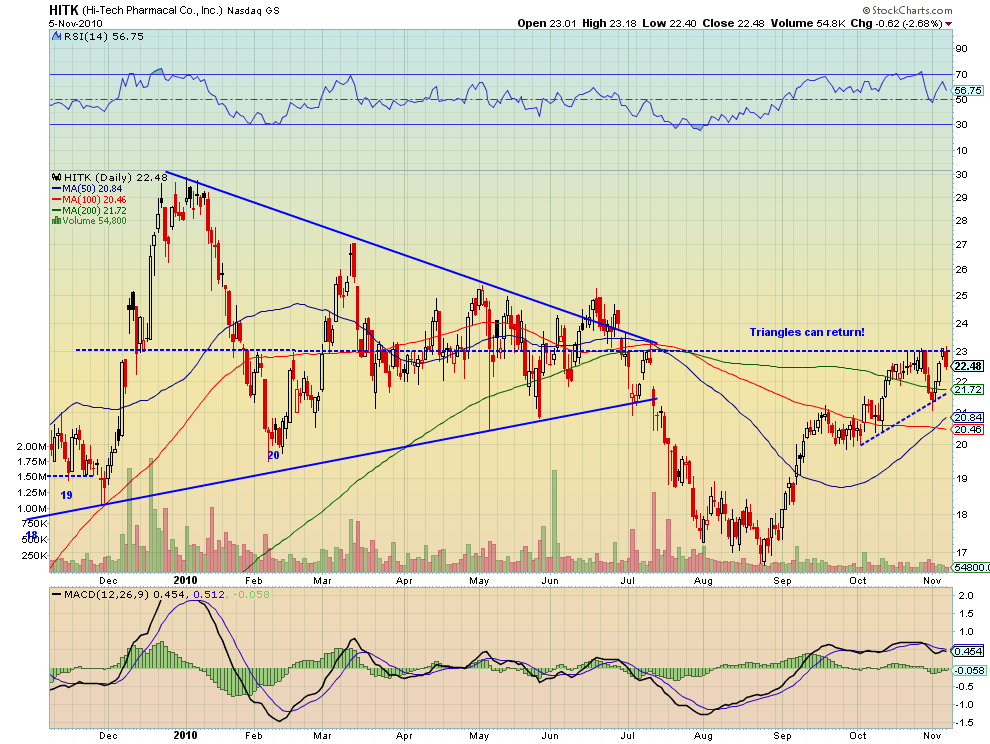
Hi Tech Pharmacal is tapping at resistance of 23, the pivot of the past symmetrical triangle. If it can get through 23 it will encounter resistance at 25 followed by 27. There is also support lower at 21.72. The MACD and RSI have turned lower so it may need to bounce off of support first.
8. Noble Drilling, Ticker: NE

Noble Drilling cracked through resistance at 36.15 Thursday, tested it Friday and held. If it continues to hold then the next resistance higher is at 38.46, followed by 40. A rising MACD and RSI suggest that it can go higher.
9. PNC Financial Services, Ticker: PNC
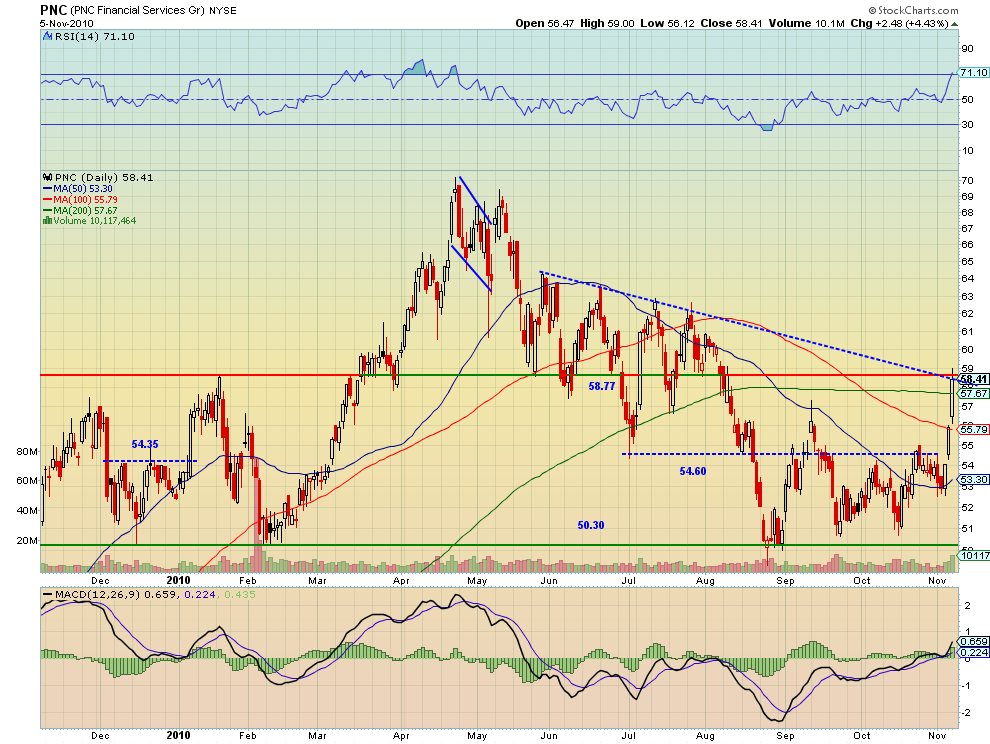
PNC shows a bullish Three Advancing White Soldiers pattern. Three consecutive long body white candles. This pattern has taken it near the intersection of the downtrend line at 58.41 and historical support/resistance line at 58.77. If it can get through these lines then it should rise to test 62 from July and then the previous highs along the down trendline. There is support at the 200 day Simple Moving Average (SMA) at 57.61. The rising RSI and MACD are supportive of a move higher.
10. STEC, Ticker: STEC
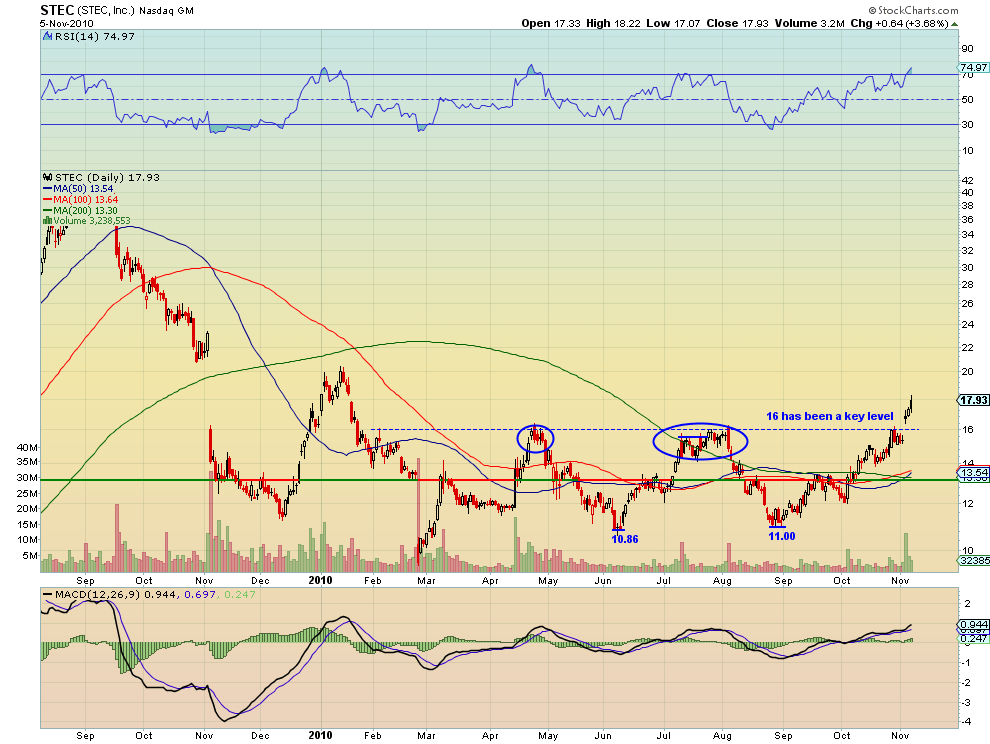
STEC broke through the key level of 16last week and is running higher. The first resistance can be found at the gap at 18.25 from early February and then at 20.45 before the gap at 20.70 from November 2009. The MACD and RSI are both rising adding to the bull case.
Bonus Idea: Radware, Ticker: RDWR
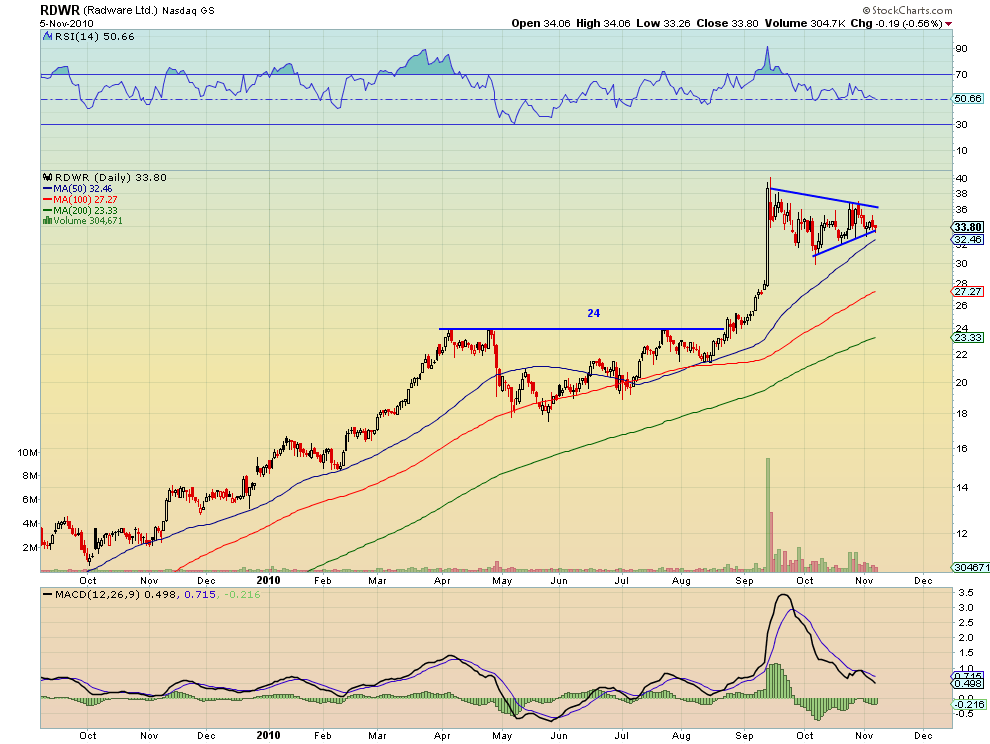
Radware has been in a bullish flag for two months. It is currently testing the bottom of the flag and printed a bullish Hammer on Friday. The RSI is near 50 and has bounced there several times before, adding to the bull case. A bounce could bring it to the top of the flag at 36. If it can get through the top then there is resistance at 40, followed by 42. Only an $8.20 move but 24%, not too shabby! First support can be found at 33.5 and then at the rising 50 day SMA below.
Trade’m well!
If you like what you see above sign up for deeper analysis and trading strategy by using the Get Premium button above. As always you can see details of individual charts and more on my StockTwits page.
The information in this blog post represents my own opinions and does not contain a recommendation for any particular security or investment. I or my affiliates may hold positions or other interests in securities mentioned in the Blog, please see my Disclaimer page for my full disclaimer.
blog comments powered by Disqus
-
 Gregory W. Harmon CMT, CFA, has traded since 1986 and held senior positions including Head of Global Trading, Head of Product Development, Head of Strategy and Director of Equity. (More)
 -
Subscribe to Dragonfly Capital Views
Lifetime Subscription
$4,000.00Sign upAnnual Subscription
$1,000.00Sign upQuarterly Subscription
$350.00Sign up
Recent Posts
- Bull Scan for 10-14-26
- Premium Earnings 10-13-26: Fastenal and Morgan Stanley
- Bull Scan for 10-13-26
- Premium Earnings 10-12-26: Citigroup and Johnson & Johnson
- 4 Trade Ideas Wells Fargo: Bonus Idea
- 5 Trade Ideas for Monday: AbbVie, Airbnb, Affirm, GE Aerospace and Walmart
- Top Trade Ideas for the Week of October 12, 2026: The Rest Premium
- Top Trade Ideas for the Week of October 12, 2026: The Best
- SPY Trends and Influencers October 10, 2026
- Macro Week in Review/Preview October 9, 2026
Archives