Measuring Volatility Without the VIX
- Posted by Greg Harmon
- on November 1st, 2010
Many eyes are focused on the Volatility Index or VIX to gain a clue as to what is going to happen to the market. But how does a change in the VIX translate into any particular stock? It doesn’t really. So what can you do? Here are a few other measures to ponder on tonight. I will use the SPY to illustrate but these measures are available for EVERY STOCK.
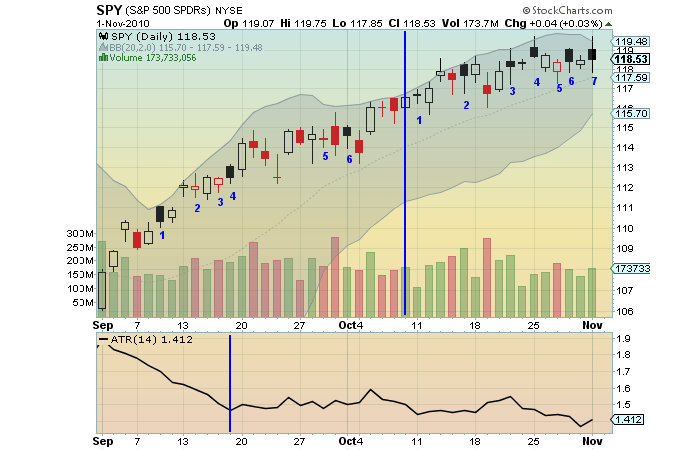
Look at the chart below of the daily SPY from the start of the latest move up until today.
Solid Blacks and Hollow Reds
The top part of the chart is split into two sections, the later part representing the last 15 trading days and the former part the first 27 days of the uptrend. Note the number of days where the SPY printed a solid black candle or a hollow red candle in each of these periods. Solid black candles are significant in that they represent days where the stock opened and closed above the previous day’s close but that during that day the close was lower than the open, for simplicity a downtrend day. Hollow red candles are the opposite. So these candles show the SPY tried to move away from the previous day but reverted back. In the first part of the chart there were 6 out of 27 trading days, or 22.22% of the time. In the second part there were 7 out of 15 trading days or 46.67% of the time. This is a major increase and actually both are unusually large. Compare it to the period from the beginning of May until the end of August, about 85 trading days, where there were just 14, or a 16.5% occurrence. What does is say? One thing it tells is something about the current trend. The recent continued reversion towards the previous day is flattening the chart, tightening the range and reducing volatility.
Tightening Bollinger Bands
Also on the top part of the chart look at how the Bollinger bands have tightened as this move has extended. Recall that the Bollinger bands show 2 standard deviations of price movement on each side of the simple moving average all measured over the last 20 days, and so their rate of change is a measure of changing volatility. In this way they are intended to capture 95% of the potential short term stock price movement. As the price becomes more stable the the 20 day standard deviation will decrease and the Bollinger bands shrink. In this case the wide bands in the first part of the chart have given way to a narrowing range in the more recent part of the chart, indicating decreasing volatility.
Average True Range
Finally look at the bottom of the chart. This panel shows the Average True Range, ATR. This is the largest of the differences between current high and low price, the current high and the previous close and the current low and the previous close averaged over a short period of time often 14 days, to smooth it. Think of it as a measure of each days range from the close or the days range it self on a wide range or outside day. Many traders will use this measure to determine where to set stop losses but it can also be used to measure volatility. Notice that in the first part of the chart the ATR is falling from 1.9 down to about 1.5 and then in the second part of the chart it is relatively stable between 1.4 and 1.6. What does this tell you? First in the initial move the expected price swings was narrowing, meaning volatility was decreasing. Second, in the more recent part of the chart, it is stabilized but relatively low.
Thanks to John Lee, @WeeklyTA on twitter, for getting me thinking about solid black candles today.
If you like what you see above sign up for deeper analysis and trading strategy by using the Get Premium button above. As always you can see details of individual charts and more on my StockTwits page.
The information in this blog post represents my own opinions and does not contain a recommendation for any particular security or investment. I or my affiliates may hold positions or other interests in securities mentioned in the Blog, please see my Disclaimer page for my full disclaimer.
blog comments powered by Disqus
-
 Gregory W. Harmon CMT, CFA, has traded since 1986 and held senior positions including Head of Global Trading, Head of Product Development, Head of Strategy and Director of Equity. (More)
 -
Subscribe to Dragonfly Capital Views
Lifetime Subscription
$4,000.00Sign upAnnual Subscription
$1,000.00Sign upQuarterly Subscription
$350.00Sign up
Recent Posts
- Bull Scan for 10-14-26
- Premium Earnings 10-13-26: Fastenal and Morgan Stanley
- Bull Scan for 10-13-26
- Premium Earnings 10-12-26: Citigroup and Johnson & Johnson
- 4 Trade Ideas Wells Fargo: Bonus Idea
- 5 Trade Ideas for Monday: AbbVie, Airbnb, Affirm, GE Aerospace and Walmart
- Top Trade Ideas for the Week of October 12, 2026: The Rest Premium
- Top Trade Ideas for the Week of October 12, 2026: The Best
- SPY Trends and Influencers October 10, 2026
- Macro Week in Review/Preview October 9, 2026
Archives