Top Trade Ideas for the Week of May 31, 2011: The Rest
- Posted by Greg Harmon
- on May 30th, 2011
Here are the Rest of the Top 10:
Hi-Tech Pharmacal, Ticker:$HITK

Hi-Tech Pharmacal is moving higher after a pullback from a break out in April. If it can get over the previous high at 27.88, then it has a target of 32.25 on a Measured Move (MM) higher. A rising Relative Strength Index (RSI) and a Moving Average Convergence Divergence (MACD) that is crossing positive both support more upside.
Universal Display, Ticker:$PANL

Universal Display has been basing in a flag lower with resistance at 47.25. The MACD is showing a positive divergence from the other indicators, crossing positive, but the RSI is moving sideways. If it can break the top of the flag then it has resistance at 50.70 and then 57.50 higher.
Sensata Technologies, Ticker:$ST

Sensata Technologies is in an ascending triangle with resistance at 36.10. If it can get through that then the target on a pattern break higher is to 39.40. The rising RSI could help out if the MACD could join it. Wait for the break.
World Acceptance, Ticker:$WRLD

World Acceptance failed at resistance near 68 and found support at the 100 day Simple Moving Average (SMA). It is rising now through the 50 day SMA and the mid line of the Bollinger bands. The next resistance is at 66 and then the previous highs. Above that it has room to run.
Zumiez, Ticker:$ZUMZ
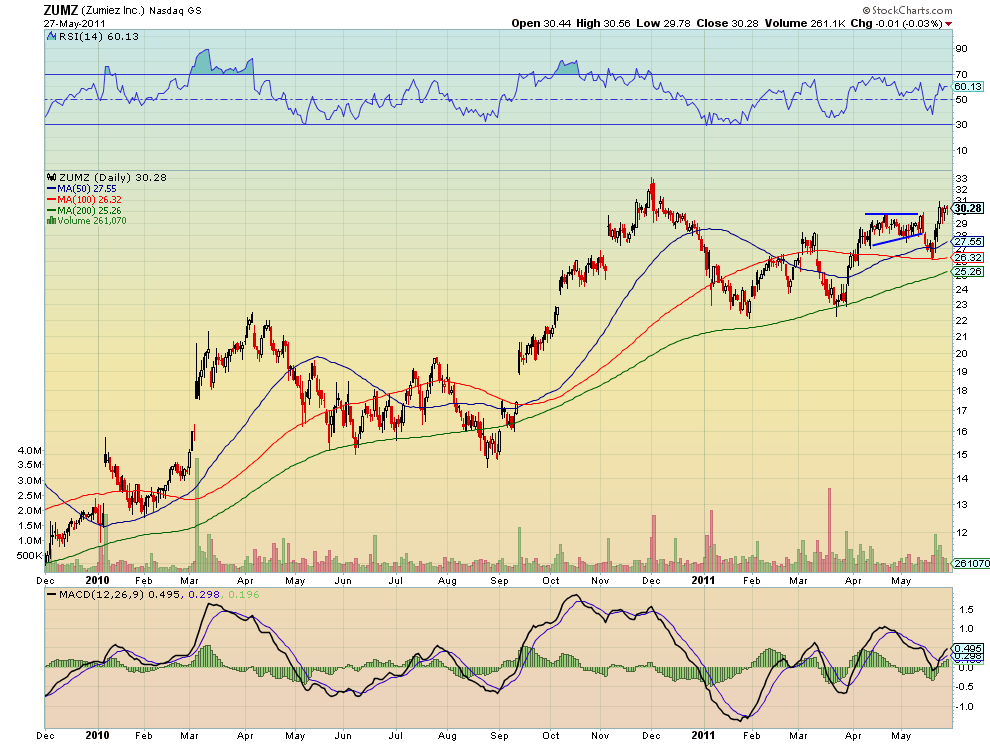
Zumiez fell from an ascending triangle but found support at the 100 day SMA and is rising, now at a higher high. If it can get over 30.50 then it has a target of 34.50 on a MM. The increasing MACD and rising RSI support more upside.
Up Next: Bonus Idea
(As always you can see details of individual charts and more on my StockTwits feed and on chartly.)
After reviewing over 800 charts, I have found some good setups for the week. These were selected and should be viewed in the context of the broad Market Macro picture reviewed Saturday which looks for more upside for Gold and a drift higher for Crude Oil. The US Dollar Index looks headed to test the recent lows while US Treasuries continue higher. The Shanghai Composite looks to continue lower after falling out of the symmetrical triangle while Emerging Markets head higher toward resistance. With continued stable and low Volatility the Equity Index ETF’s are diverging, with the IWM looking better to the upside while the SPY and QQQ need to break resistance to join it and so are looking better to the downside. This divergence should resolve soon but could also lead to more sideways action. Use this information to understand the major trend and how it may be influenced as you prepare for the coming week ahead. Trade’m well.
If you like what you see above sign up for deeper analysis and trading strategy by using the Get Premium button above. As always you can see details of individual charts and more on my StockTwits page.
The information in this blog post represents my own opinions and does not contain a recommendation for any particular security or investment. I or my affiliates may hold positions or other interests in securities mentioned in the Blog, please see my Disclaimer page for my full disclaimer.
blog comments powered by Disqus
-
 Gregory W. Harmon CMT, CFA, has traded since 1986 and held senior positions including Head of Global Trading, Head of Product Development, Head of Strategy and Director of Equity. (More)
 -
Subscribe to Dragonfly Capital Views
Lifetime Subscription
$4,000.00Sign upAnnual Subscription
$1,000.00Sign upQuarterly Subscription
$350.00Sign up
Recent Posts
- 5 Trade Ideas for Monday: AbbVie, Airbnb, Affirm, GE Aerospace and Walmart
- Top Trade Ideas for the Week of October 12, 2026: The Rest Premium
- Top Trade Ideas for the Week of October 12, 2026: The Best
- SPY Trends and Influencers October 10, 2026
- Macro Week in Review/Preview October 9, 2026
- Bull Scan for 10-12-26
- How this Week’s Premium Top 10 Performed, October 9, 2026
- Bull Scan for 10-9-26
- Bull Scan for 10-8-26
- Bull Scan for 10-7-26
Archives