From the Charts: Macro Week in Review/Preview November 5, 2010
- Posted by Greg Harmon
- on November 5th, 2010
Last week’s review of the macro market indicators for the week looked to bring a continued rise in the price for Gold. Crude Oil and the US Dollar Index were looking for a catalyst to move out of their recent ranges. US Treasury Bonds look to continue lower as emerging market moved higher. Volatility looked like it may be making a comeback which could stall the equity markets. Equities looked good and still in their uptrends with the QQQQ a strong leader. The monthly review reinforced this view and looked even more positive.
Monday came and Gold and US Treasuries bounced around early, Crude Oil found its leg and moved higher. After pausing Monday the US Dollar Index resumed its downward move giving a bid to equities and emerging markets. Then came Quantitative Easing (QE2) and a strong response in the markets Thursday. Let’s look at the charts.
(As always you can see these individual charts and more on my twitter feed and on chartly.)
Gold Daily
Gold Weekly

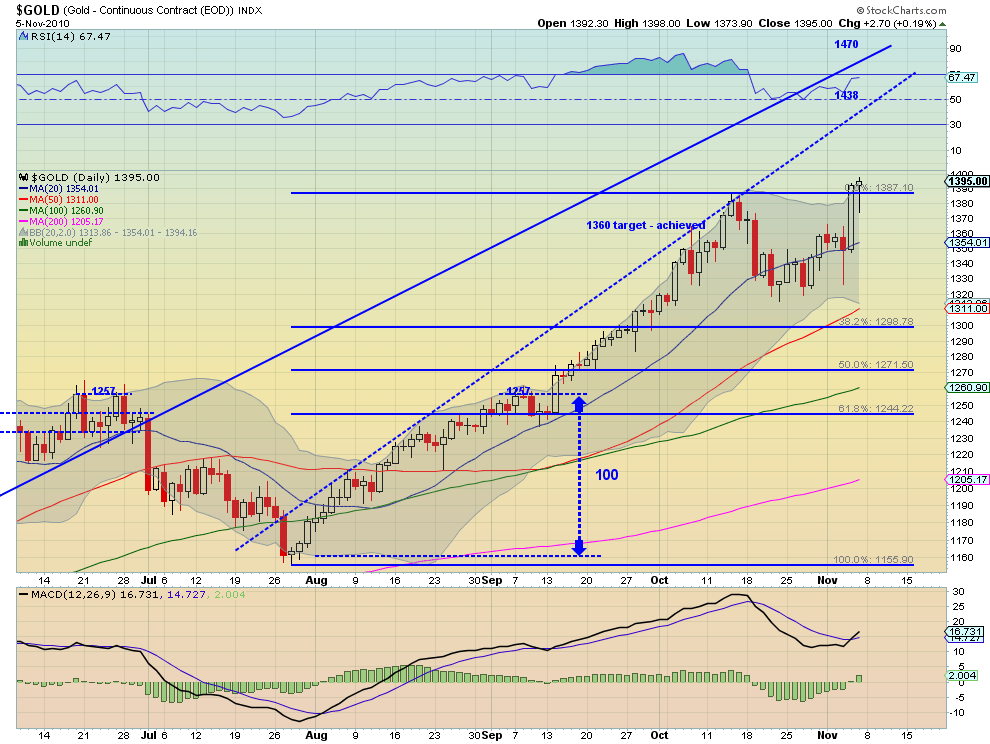
Gold really liked the resolution of the uncertainty surrounding the size of the QE2, taking off Wednesday afternoon and barely looking back until peeking at 1400. It looks like there is more left in the tank. On the daily chart it held above the previous high at 1387.10, and the Moving Average Convergence Divergence (MACD) indicator just crossed bullish, with a rising Relative Strength Index (RSI) to boot. The weekly chart shows it holding above the mid line of the rising channel and now poised for a run at 1462. There is resistance on the way at 1438 from the trend line on the daily chart. Support comes at the previous high of 1387.10 and then 1370 and the 20 day Simple Moving Average at 1354.
West Texas Intermediate Crude Daily

West Texas Intermediate Crude Weekly

Crude Oil has been on fire all week closing near its highs. It looks to have finally pulled away from the 81 to 84 consolidation area and is headed for the 88.50 to 100 range from late 2008. The 83 to 84 area will act as support now as will the 86 high from May on the daily chart. The RSI is rising and the MACD crossed bullish Wednesday, adding to the bull case. The weekly chart clearly shows the bullish move to the top of the long consolidation area. The MACD and RSI are supportive on this chart as well, and the weekly shows how strong the support is at 81. Look for Crude to hit the higher range quickly.
US Dollar Index Daily

US Dollar Index Weekly
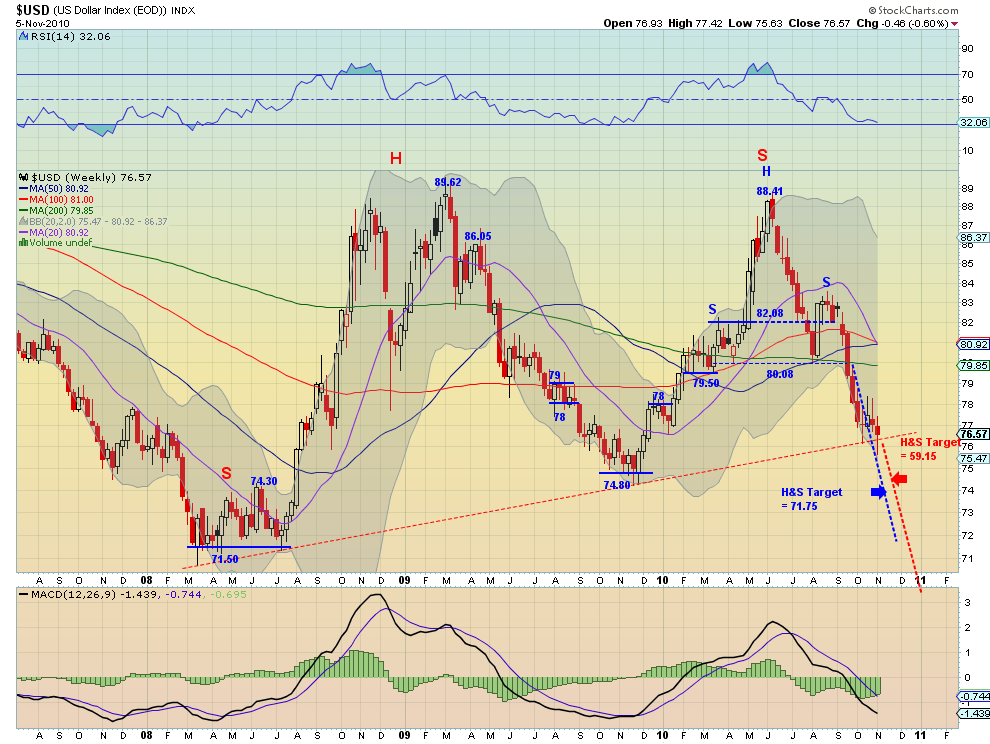
The US Dollar Index had a horrible week, but managed to recover a bit on Friday. The trend is still down. Support shows up on the daily chart at 76.15 followed by 76 and then 75 before it gets really ugly. Note that there is also a bearish Head and Shoulders Top (in blue on the weekly) on the daily chart with a neckline at the 76.15 level. This lies within a broader Head and Shoulders Top on the weekly chart. The weekly chart shows just how ugly it could get, with support at 74.30 to 74.80 before a longer bottom at 71.50. The RSI is falling on both charts and both have a negative MACD with the daily chart just producing a bearish cross.
iShares Barclays 20+ Yr Treasury Bond Fund Daily
iShares Barclays 20+ Yr Treasury Bond Fund Weekly

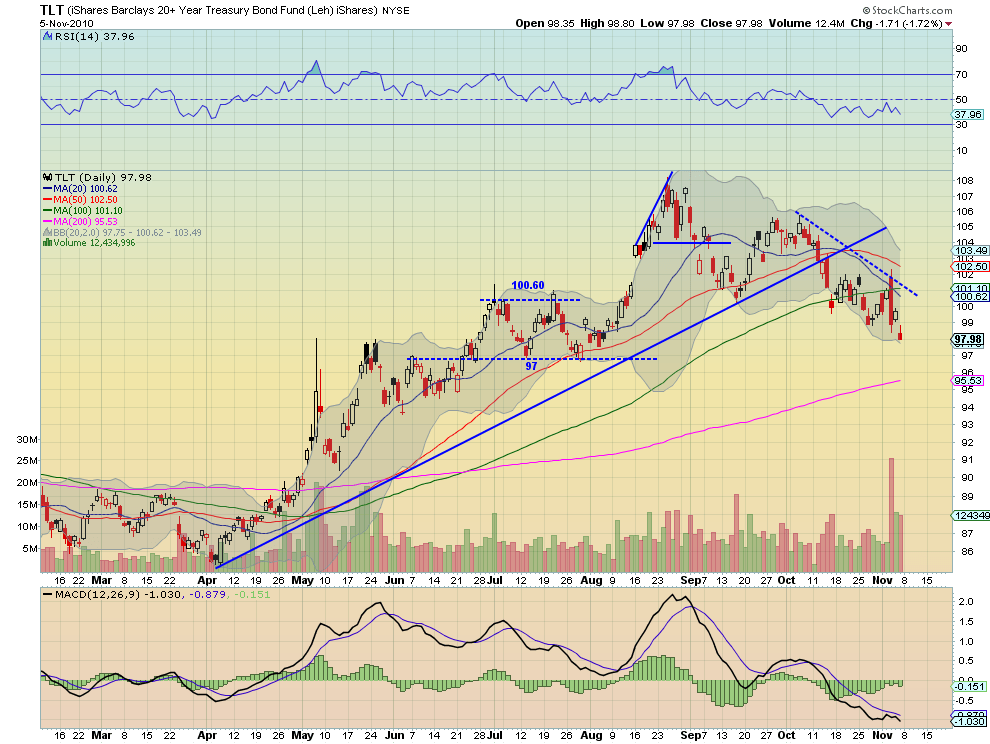
The proxy for US Treasuries, TLT bounced around the early part of the week as it has been doing. As soon as the QE2 announcement came out though it started a free fall from which it did not recover. It is in a clear downtrend now with support at 97 on the daily chart and resistance near the bearish 20 day/100day Simple Moving Average (SMA) cross at 100.60-101.10. The MACD and RSI on the daily chart support a further move lower. The weekly chart shows the string of red candles right on top of support at 97.69. Looking left there is next support at 95 to 95.50 and then the SMA cross near 94.25 and the 92 area. Do not own bonds.
iShares MSCI Emerging Markets Index Daily

iShares MSCI Emerging Markets Index Weekly

The proxy for emerging markets, EEM, ran up big on the QE2 news and consolidated Friday back into the Bollinger bands. It has resistance now at 48.78 and then 50.17, both from 2008. Support comes at the gap at 47.50 then 47. The weekly chart shows a great trend up from the channel break out and continued progress to the target at 55. Support comes at the channel at 43.40. Both charts show a rising MACD and a strong RSI. Look for it to go higher.
VIX Daily
VIX Weekly
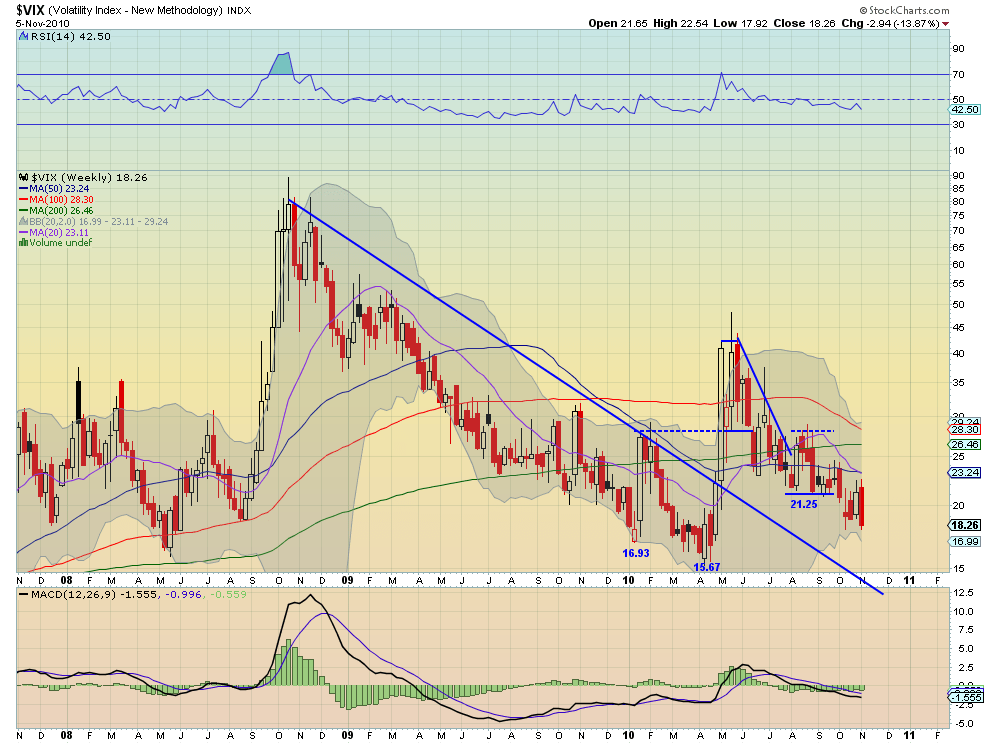
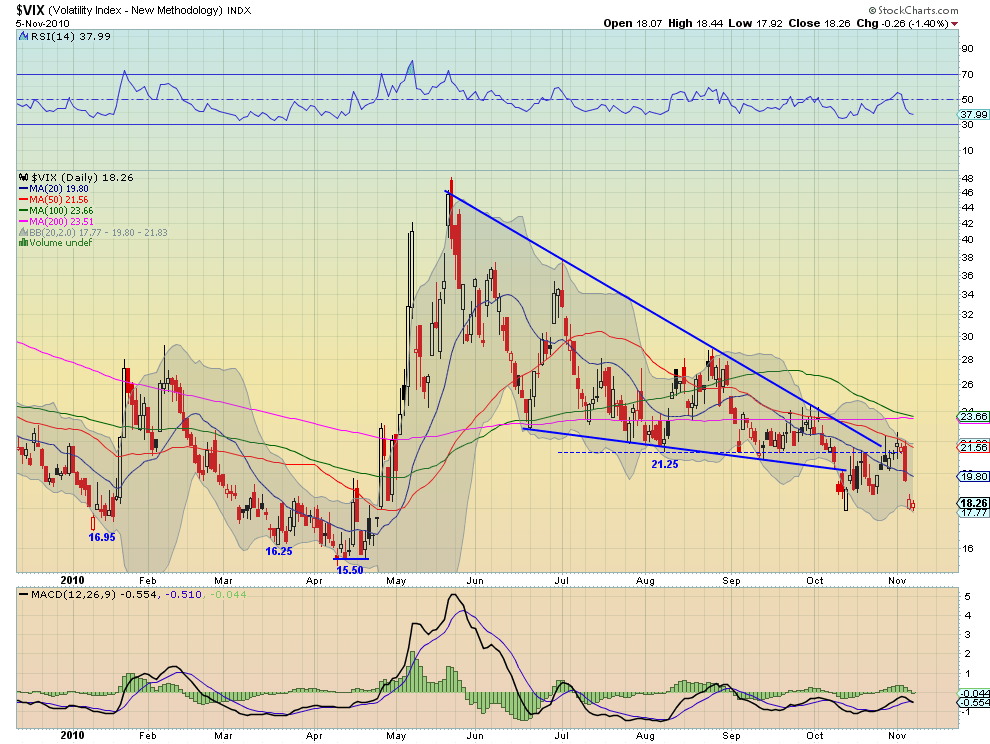
After testing the 21.25 resistance area volatility got shaken out of the market by the QE2 announcement and the VIX is again testing 18 support with 17 and then 16.25 and 15.50 below that. The weekly charts looks to be setting up for another move lower with a big bear engulfing candle this week, back towards the long term trend line. This bodes well for stocks going higher.
SPY 60 minute

SPY Daily
SPY Weekly
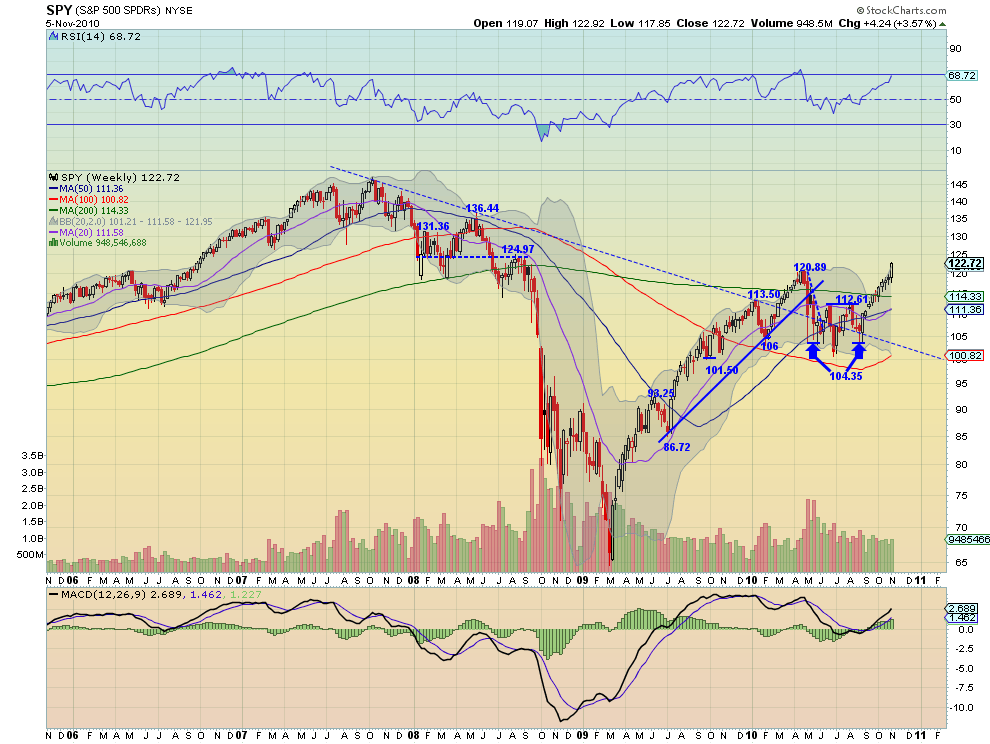
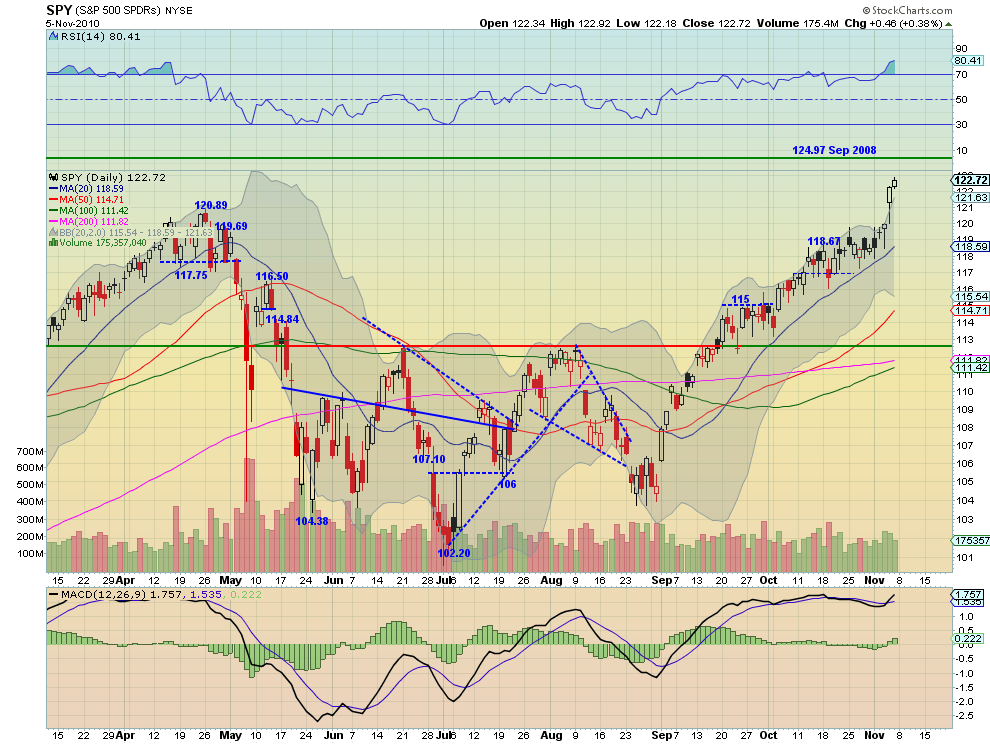
The SPY was tentative when it pulled out of the consolidation range between 117 and 118.75 on Tuesday but then took off on Thursday. It now sees resistance at 124.97, the high from September 2008. It is above the Bollinger band on the daily chart and has a high RSI so it might rest or pullback before moving further. The hourly chart shows the gap between 120.02 and 121.13 as logical support, short term. Support on the daily comes at 120.89 and then 119.69 before the previous channel. The weekly chart shows resist above at 131.36 when it gets through the September 2008 high. Both the daily and the weekly show a strong RSI and positive MACD supporting further upside.
IWM Daily

IWM Weekly
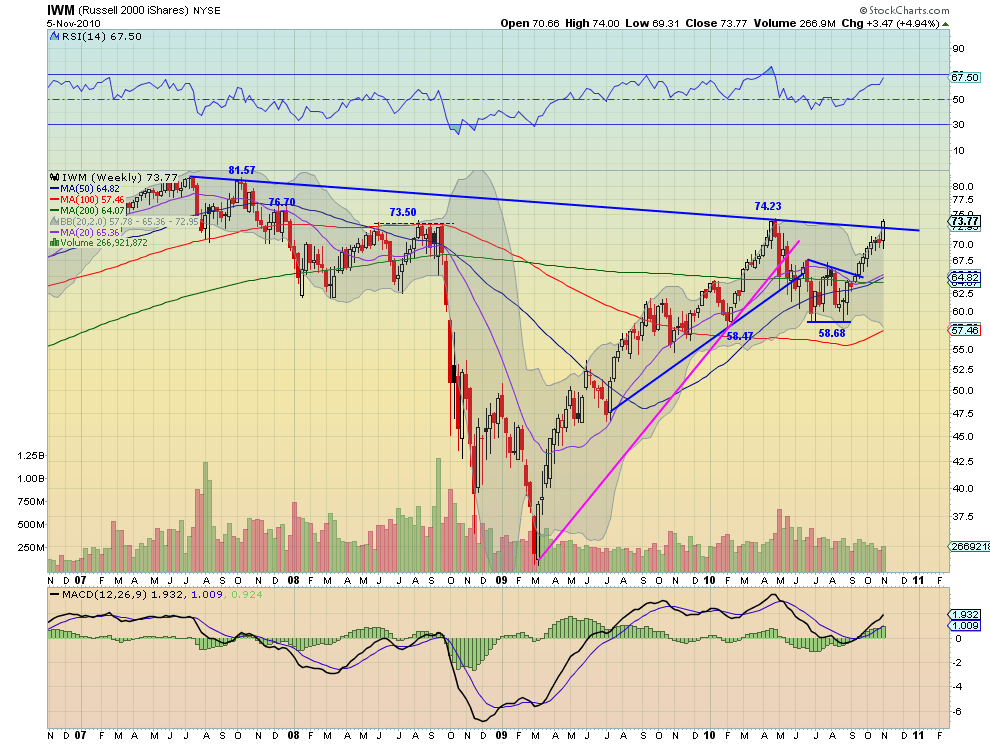
The IWM had a similar week to the SPY peeking above its consolidation range (70 to 71.25) on Tuesday and then rocketing higher after the QE2 announcement. It is also out of the Bollinger band and may experience a pause or pullback, but the recent bullish MACD cross and rising RSI bode for higher prices. Resistance can be found at 74.23 and then the December 2007 high of 76.75. Support can be found at 72.75 and then 72 before the previous channel. The weekly chart is more bullish having broken the descending trendline from 2007. The MACD and RSI on the weekly also support further upside, and show a next resistance above the 76.75 area at 81.57.
QQQQ Daily

QQQQ Weekly
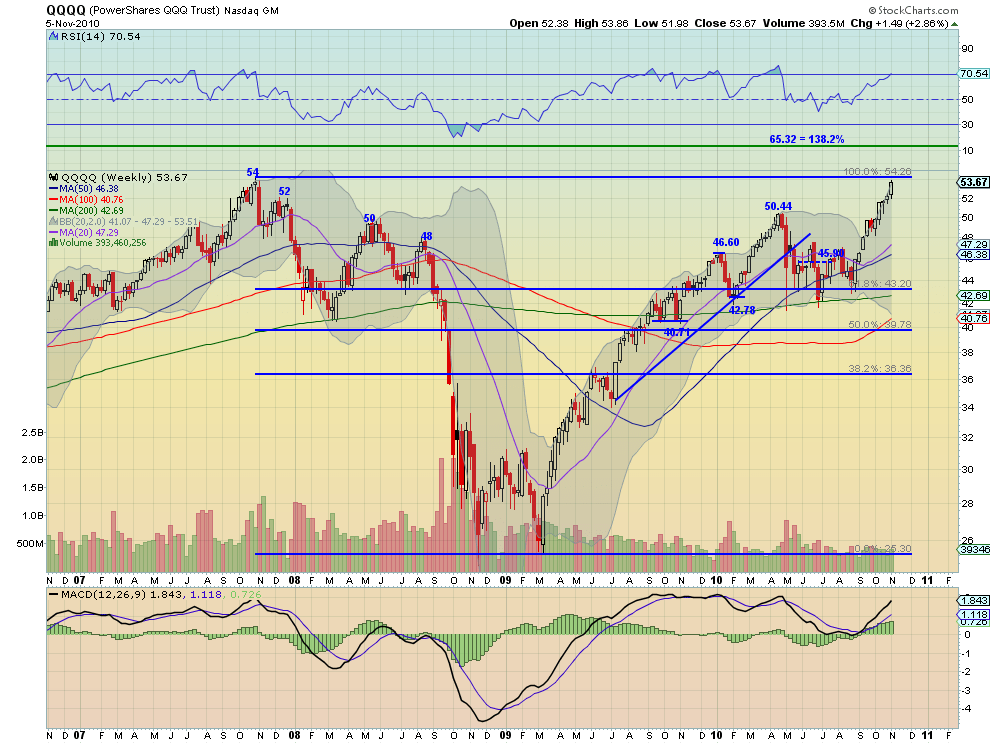
The Q’s were the strongest of the Index ETF’s coming into the week and continued their run higher similarly to the SPY and IWM. After the QE2 announcement it gapped higher but paused today, getting back within its Bollinger bands. The rising SMA’s, MACD and RSI are all positive signs going forward. Resistance comes at 54.26 from October 2008. Support can be found at the gap at 53 then 52.50 and 51.72 on the daily chart. the weekly chart is also very positive with rising SMA’s, RSI and MACD. Resistance above the 54.26 area does not show up until looking back to 2001. I have posted a Fibonacci retracement forecast of 65.32 to give it more relevance to the more recent movement in price.
So next week looks to bring stronger prices for Gold and Oil and further weakness for the US Dollar Index and US Treasury Bonds. This will aid emerging market stock prices. Volatility looks to continue to be relatively low and weak giving a supportive environment for equity prices to continue their rise. Good luck next week!
If you like what you see above sign up for deeper analysis and trading strategy by using the Get Premium button above. As always you can see details of individual charts and more on my StockTwits page.
The information in this blog post represents my own opinions and does not contain a recommendation for any particular security or investment. I or my affiliates may hold positions or other interests in securities mentioned in the Blog, please see my Disclaimer page for my full disclaimer.
blog comments powered by Disqus
-
 Gregory W. Harmon CMT, CFA, has traded since 1986 and held senior positions including Head of Global Trading, Head of Product Development, Head of Strategy and Director of Equity. (More)
 -
Subscribe to Dragonfly Capital Views
Lifetime Subscription
$4,000.00Sign upAnnual Subscription
$1,000.00Sign upQuarterly Subscription
$350.00Sign up
Recent Posts
- Bull Scan for 10-14-26
- Premium Earnings 10-13-26: Fastenal and Morgan Stanley
- Bull Scan for 10-13-26
- Premium Earnings 10-12-26: Citigroup and Johnson & Johnson
- 4 Trade Ideas Wells Fargo: Bonus Idea
- 5 Trade Ideas for Monday: AbbVie, Airbnb, Affirm, GE Aerospace and Walmart
- Top Trade Ideas for the Week of October 12, 2026: The Rest Premium
- Top Trade Ideas for the Week of October 12, 2026: The Best
- SPY Trends and Influencers October 10, 2026
- Macro Week in Review/Preview October 9, 2026
Archives