Picking The Car Company That Fits Your Style
- Posted by Greg Harmon
- on May 10th, 2011
There are some choices that are just downright difficult to make. Like choosing the right car company. Sedans, Sports cars, Trucks, SUV’s. Gas, Electric, Hybrid. All the options and warranties. And that is before you throw your trading style into the mix. Huh?
At least I can help out with the last part. Whether you are a short term day trader, swing trader or longer term position trader there is a car company for you to trade.
Day Trader

For the short term trader there is General Motors (ticker: $GM). Above is the hourly chart for General Motors over the last four months and it is set up for a quick trade to the upside. After falling from the double top at 33.33 it has found support at the bullish cross of the 100 and 200 hour Simple Moving Averages (SMA) and is starting to turn higher. Also the Relative Strength Index (RSI) has bounced and is sloping higher with a Moving Average Convergence Divergence (MACD) indicator that has just crossed higher. Using eh 200 hour SMA at 31.48 as a stop, this can be a quick trade up to the 50 hour at 32.21 and then the resistance at 32.50 above that. If it can get through 32.50 then look for a third test of 33.33.
Swing Trader
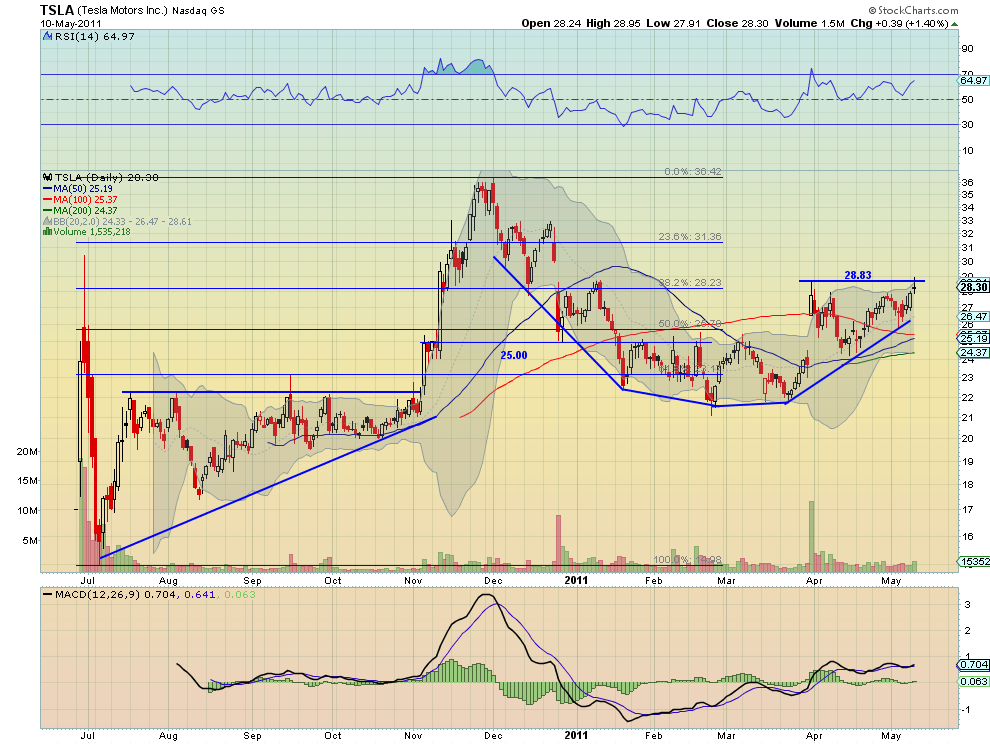
For the swing trader Tesla Motors (ticker: $TSLA) fits the bill. After coming off of a top at 36.42 the daily chart shows it put in a rounded bottoming pattern over 3 months before gapping higher to 28.83. Now with a pullback under its belt it is testing 28.83 again off of a rising trend line with a rising RSI and crossing MACD. It also has a bullish 50/100 day SMA cross about to print. But there is a caution with the doji print Tuesday. If it can get over and hold 28.83 then look for it to continue higher with resistance at the gap at 30 and then the Fibonacci level at 31.36 followed by previous resistance at 33.
Position Trader

For the trader that can hold a position for more than a week a good choice would be Tata Motors (ticker: $TTM). The weekly chart above shows that Tata fell from a rising 18 month channel in January but has since continued to trend higher but at a shallower slope. With the last 5 weeks riding the 20 week SMA lower to now meet the uptrend it is at a critical junction. If the trend line holds then get long for a ride to test 30 and then 36 again. If it cracks the trendline then there is support at the 50 week SMA and previously between 24 ad 25 and below that it can be shorted down to support first at 22 and then 20 and 18.
So whatever your trading style there is a car company for you. Pick the right one and make sure to use the emergency brakes (stops).
As always you can see details of individual charts and more on my StockTwits feed and on chartly.)
If you like what you see above sign up for deeper analysis and trading strategy by using the Get Premium button above. As always you can see details of individual charts and more on my StockTwits page.
The information in this blog post represents my own opinions and does not contain a recommendation for any particular security or investment. I or my affiliates may hold positions or other interests in securities mentioned in the Blog, please see my Disclaimer page for my full disclaimer.
blog comments powered by Disqus
-
 Gregory W. Harmon CMT, CFA, has traded since 1986 and held senior positions including Head of Global Trading, Head of Product Development, Head of Strategy and Director of Equity. (More)
 -
Subscribe to Dragonfly Capital Views
Lifetime Subscription
$4,000.00Sign upAnnual Subscription
$1,000.00Sign upQuarterly Subscription
$350.00Sign up
Recent Posts
- 4 Trade Ideas Wells Fargo: Bonus Idea
- 5 Trade Ideas for Monday: AbbVie, Airbnb, Affirm, GE Aerospace and Walmart
- Top Trade Ideas for the Week of October 12, 2026: The Rest Premium
- Top Trade Ideas for the Week of October 12, 2026: The Best
- SPY Trends and Influencers October 10, 2026
- Macro Week in Review/Preview October 9, 2026
- Bull Scan for 10-12-26
- How this Week’s Premium Top 10 Performed, October 9, 2026
- Bull Scan for 10-9-26
- Bull Scan for 10-8-26
Archives