‘V’ is For Victory in Pharmaceuticals
- Posted by Greg Harmon
- on May 9th, 2011
Pharmaceuticals have been a hot sector the last few weeks. And it is no wonder. Picking a winner is like picking the right scratch off ticket at the corner store. You know that there are winners there, but which ones? And with winners coming randomly you have to buy a lot of them to get a good shot at winning. But strangely that is not the case in one part of the sector: stocks with tickers that start with the letter ‘V’. Sounds crazy doesn’t it. Not only are letter ‘V’ stocks breaking out higher but they are doing so alphabetically! Check it out. If you print all four charts for the stocks below they look like one of those flip motion books.
Vertex Pharmaceuticals , ticker: $VRXT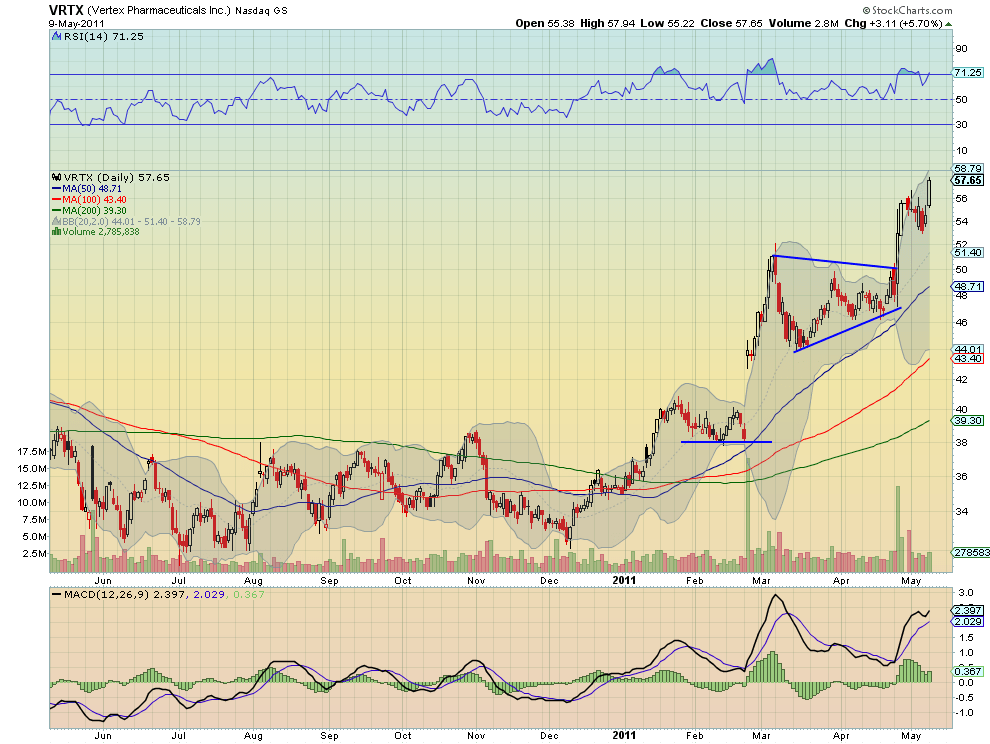
Vertex Pharmaceuticals broke a bull flag higher Monday and with a rising Relative Strength Index (RSI) and an increasing Moving Average Convergence Divergence (MACD) indicator has room to run higher. The price target on a Measured Move (MM) is 62.
Pharmasset, ticker: $VRUS

Pharmasset clearly was an early identifier in the ‘V’ phenomenon and selected its ticker symbol wisely. This stock is set up beautifully to break out higher. It probed above the previous high of 108 from April 21 with increasing volume and looks ripe for more. The RSI is rising the MACD is improving and the tight Bollinger bands are beginning to expand as it presses against the top band. Above 108 it has a first MM to 113 and then a second MM target as high as 143.
Valeant Pharmaceuticals, ticker: $VRX

Valeant Pharmaceuticals fell from a bull flag last Monday but has been recovering since and is now back to the flag level, crossing the mid point of the Bollinger bands Monday. As it moves higher the RSI is sloping steeply higher and the MACD is improving towards a cross. Watch this one for a break above the flag over 54.50. When it does the target on a MM is 62.50.
Vivus, ticker: $VVUS

Vivus has been moving higher after bottoming in mid March through a series of rounded steps. If it continues and moves higher off of the latest low at 7.75 and above 8.40 then look for the next step to reach resistance at the gap at 8.83. This one is not as good looking as the RSI is fairly flat and the MACD is about to cross negative.
So will Vivus end the ‘V’ is for Victory party or is ‘W’ next?
As always you can see details of individual charts and more on my StockTwits feed and on chartly.)
If you like what you see above sign up for deeper analysis and trading strategy by using the Get Premium button above. As always you can see details of individual charts and more on my StockTwits page.
The information in this blog post represents my own opinions and does not contain a recommendation for any particular security or investment. I or my affiliates may hold positions or other interests in securities mentioned in the Blog, please see my Disclaimer page for my full disclaimer.
blog comments powered by Disqus
-
 Gregory W. Harmon CMT, CFA, has traded since 1986 and held senior positions including Head of Global Trading, Head of Product Development, Head of Strategy and Director of Equity. (More)
 -
Subscribe to Dragonfly Capital Views
Lifetime Subscription
$4,000.00Sign upAnnual Subscription
$1,000.00Sign upQuarterly Subscription
$350.00Sign up
Recent Posts
- 4 Trade Ideas Wells Fargo: Bonus Idea
- 5 Trade Ideas for Monday: AbbVie, Airbnb, Affirm, GE Aerospace and Walmart
- Top Trade Ideas for the Week of October 12, 2026: The Rest Premium
- Top Trade Ideas for the Week of October 12, 2026: The Best
- SPY Trends and Influencers October 10, 2026
- Macro Week in Review/Preview October 9, 2026
- Bull Scan for 10-12-26
- How this Week’s Premium Top 10 Performed, October 9, 2026
- Bull Scan for 10-9-26
- Bull Scan for 10-8-26
Archives