Get Ready for Some Back Slapping on CSPAN, and the White House Lawn
- Posted by Greg Harmon
- on May 5th, 2011
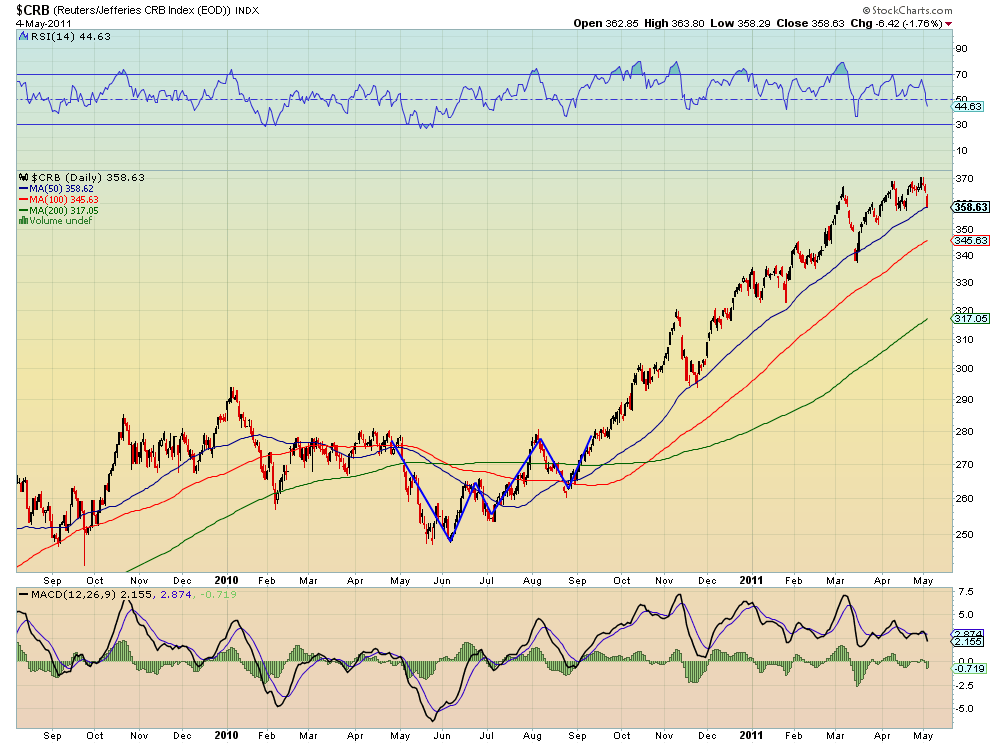
The Federal Reserve has continued to state that long term inflation pressures and expectations are under control and that what we are seeing at the supermarket and the pumps is a short lived phenomenon. Well if they are right then this week maybe the beginning of that inflation bubble bursting. Below is the chart for the CRB Index. It is an un-weighted geometric average containing 17 commodities. The index covers energy, grains, industrials, livestock, precious metals, and agricultures. A broad measure of inflation. The 50 day Simple Moving Average (SMA) has been support for any pullback since the run up after completing a W-V pattern in September. It is right there again. Keep an eye on this, for a firm break below the 50 day SMA will invariably bring out Ben and friends to observe that they are right. I will be convinced on a break below 340.
As always you can see details of individual charts and more on my StockTwits feed and on chartly.)
If you like what you see above sign up for deeper analysis and trading strategy by using the Get Premium button above. As always you can see details of individual charts and more on my StockTwits page.
The information in this blog post represents my own opinions and does not contain a recommendation for any particular security or investment. I or my affiliates may hold positions or other interests in securities mentioned in the Blog, please see my Disclaimer page for my full disclaimer.
blog comments powered by Disqus
-
 Gregory W. Harmon CMT, CFA, has traded since 1986 and held senior positions including Head of Global Trading, Head of Product Development, Head of Strategy and Director of Equity. (More)
 -
Subscribe to Dragonfly Capital Views
Lifetime Subscription
$4,000.00Sign upAnnual Subscription
$1,000.00Sign upQuarterly Subscription
$350.00Sign up
Recent Posts
- Premium Earnings 10-12-26: Citigroup and Johnson & Johnson
- 4 Trade Ideas Wells Fargo: Bonus Idea
- 5 Trade Ideas for Monday: AbbVie, Airbnb, Affirm, GE Aerospace and Walmart
- Top Trade Ideas for the Week of October 12, 2026: The Rest Premium
- Top Trade Ideas for the Week of October 12, 2026: The Best
- SPY Trends and Influencers October 10, 2026
- Macro Week in Review/Preview October 9, 2026
- Bull Scan for 10-12-26
- How this Week’s Premium Top 10 Performed, October 9, 2026
- Bull Scan for 10-9-26
Archives